
Double-digit growth in investment in Azerbaijan does not mean an equal expansion of orders across all sectors. For January–August 2026, investment in fixed capital increased in real terms by 10.0%, to 12,677.8 million manats. At the same time, oil and gas investment grew by 32.4%, while non-oil and gas investment grew by 1.4%. The main result of the State Statistics Committee's data is not only the overall rise, but also the noticeable gap between its parts.
Most of the money is not where the highest rate is
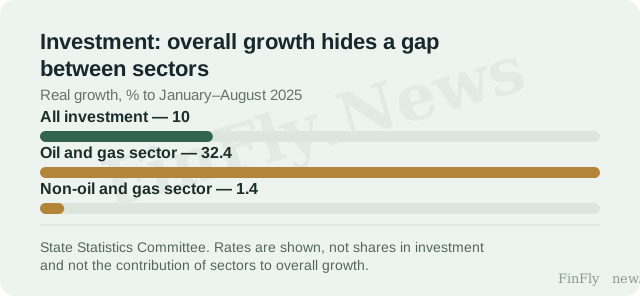
The oil and gas sector accounted for 4,246.7 million manats of investment, while the non-oil and gas sector accounted for 8,431.1 million. According to FinFly's calculation, non-oil and gas investment makes up about 66.5% of the total in current prices. Therefore, it would be incorrect to claim that oil and gas absorbed most of the investment. It leads in growth rate, but not in the volume of money in the breakdown under consideration.
The distinction is also important for assessing the sustainability of the rise. The high rate of one sector may coexist with much more moderate dynamics in the larger block by current volume. However, the published nominal shares are not ready-made weights for accurately calculating each sector's contribution to real growth. Here one can confidently speak of unevenness, but not distribute the overall ten percent among sectors without additional comparable data.
A different breakdown — different possibilities
By use, investment in the production of goods increased by 19.6%, to 7,040.7 million manats. Investment in services decreased by 0.7%, to 3,850.6 million, while investment in housing construction increased by 1.8%, to 1,786.5 million. This is another cut of the same total volume, not additional money on top of the oil and gas and non-oil and gas amounts.
For an equipment supplier, these differences can be more useful than a single national rate. Overall growth in investment does not indicate which machines, works or services have seen demand. A company serving a certain circle of clients may face a weaker market even with a favorable overall indicator. Conversely, a subdued aggregate does not rule out a large order within a particular area.
The construction decline does not refute investment growth
Value added in construction over the same eight months decreased by 12.5% in real terms. Against the backdrop of investment growth, this looks unexpected, but the indicators are not identical: one reflects the activity of the sector, the other — investment in fixed assets. Investment is not exhausted by construction works, and housing investment does not describe all construction. The dynamics of one series cannot be transferred to the other.
The releases do not provide grounds to name specific projects that formed the gap, or to assert that new capacities have already begun to bring additional output. Time may pass between investment and production results. To assess prospects, the composition of assets and their use are important, not only the fact of increased spending on fixed capital.
What to check in the next data
For a broader investment rise, a meaningful signal would be an acceleration of investment outside a single leading block. This should be checked using comparable sectoral dynamics, not by the difference of two cumulative percentages as if it were monthly growth. The persistence of a moderate non-oil and gas rate, on the contrary, will mean that the overall indicator still cannot be considered a universal benchmark for all suppliers.
For now, the takeaway for business is the targeted nature of opportunities. Investment is growing, but the customer's sector and the purpose of the investment determine how much the overall rise applies to a specific company. The national 10% gives reason to study the market for orders, not to automatically increase one's own sales forecast by the same amount.