
For the same cumulative period January–August 2026, the State Customs Committee of Azerbaijan records the value of crude oil exports at 9281.89355 million US dollars, and the value of natural gas exports at 5710.86927 million US dollars. Total exports of goods for the same period are estimated at 21815.04 million US dollars. The oil and gas lines are subsets of total exports, not a standalone aggregate that could be added to it or to each other as independent quantities. It is also significant that value and volume are accounted for separately: gas appears as a separate line of 16.37757925 billion cubic meters, oil at 14.6779516 million tonnes. These are levels for a fixed cumulative period, not dynamics.
What exactly the absolute levels show
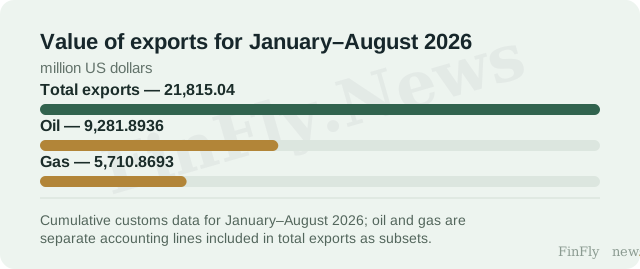
The customs authority estimates total exports of goods for January–August 2026 at 21815.04 million US dollars, imports at 11423.35 million US dollars, and the foreign trade balance at 10391.69 million US dollars. Within export value, the oil line (9281.89355 million US dollars) and the gas line (5710.86927 million US dollars) are separate accounting items. They are included in total exports as its subsets, so they cannot be added to the total aggregate or to each other as independent quantities. These are different dimensions of the same export flow.
The key distinction here is not which hydrocarbon is "larger," but that value and volume are accounted for separately. Oil appears both in tonnes (14.6779516 million tonnes) and in dollars; gas in billions of cubic meters (16.37757925) and in dollars. Therefore the volume line for gas by itself does not describe its contribution to foreign currency revenue, and the value line for oil does not describe physical supplies. There is no comparable cumulative period from previous years in the provided data, so there is no basis to speak of growth, decline, or a shift in structure.
Where the boundary of data sufficiency lies
For a company whose contracts, procurement budget, or pricing policy are tied to the structure of foreign currency revenue, the levels given set a boundary: the oil line remains the largest value component among the two named, and the gas line is the second. But these numbers are not evidence of either growth or decline, nor of a shift in structure: the provided data contain not a single comparable cumulative period from previous years and no changes. The intermediate link between sector statistics and a specific firm's decision is its own contracts, access to markets, and capacity utilization; customs lines do not describe them.
The practical conclusion is conditional. If the decision depends on whether the revenue structure is stable, then a single snapshot for January–August 2026 is insufficient — a second comparable cumulative period with the same lines is needed. If, however, the decision depends only on the absolute scale of current supplies, then the levels already provide a reference point. The difference between these two cases is precisely the boundary beyond which the data cease to be sufficient. None of these levels by itself justifies a change in the borrowing budget, pricing policy, or procurement plan.
The value structure of exports for January–August 2026 reads as follows: oil — 9281.89355 million US dollars, gas — 5710.86927 million US dollars, with total exports of 21815.04 million US dollars. These are levels for a fixed cumulative period, not dynamics. The next comparable observation is the customs publication for the same cumulative period with the same lines: total exports, the value of oil and gas, and their volume indicators. It is the comparison of two cumulative periods, not a single snapshot, that will show whether the value structure is changing.