
Identical price growth does not mean identical losses for all households. If half of a budget goes to food, an increase in food prices is felt more strongly than by a person with a high share of savings. That is why the dispute between official inflation and the shopper's perception often begins with an incorrect comparison. Statistics describe an average basket, while a person pays for their own.
What September showed
According to data from the State Statistics Committee published on October 12, consumer prices in September 2026 were 5.5% higher than a year earlier. The group of food, beverages and tobacco rose in price by 6.9%, non-food goods by 3.6%, and services by 5.1%. Over the month, the overall index rose by 0.9%. These are different comparisons: the annual figure describes the change over twelve months, the monthly one only over September.
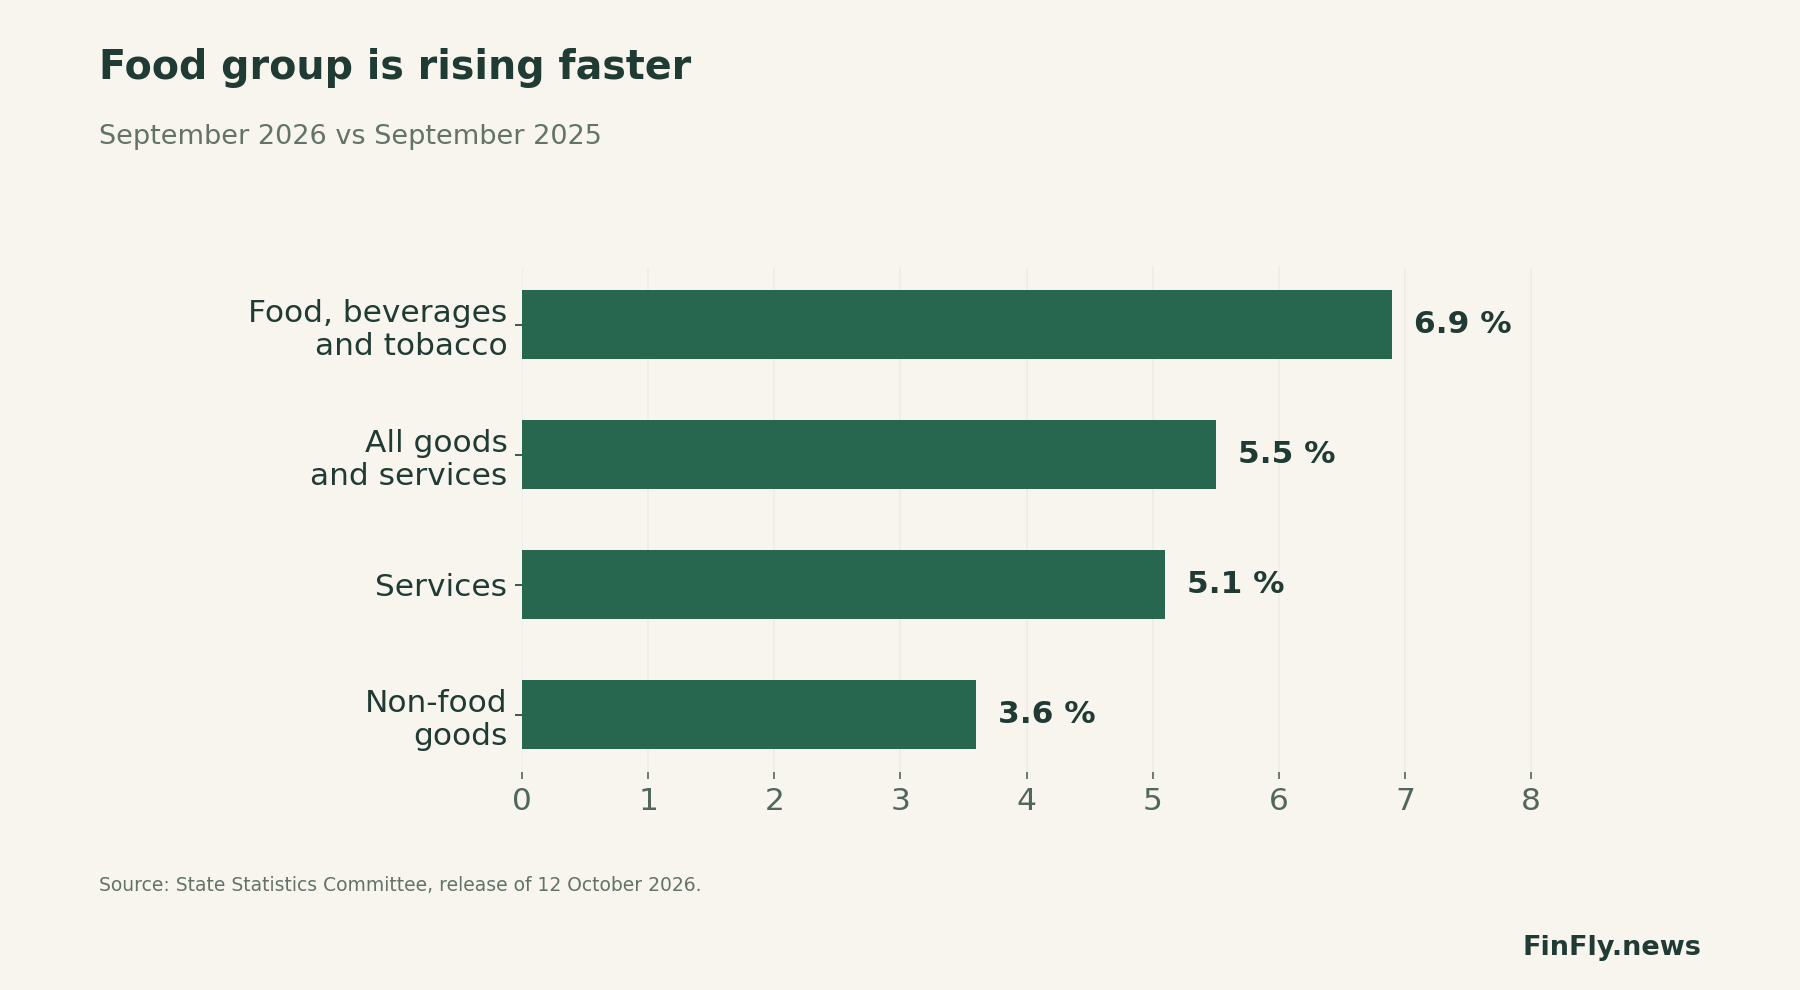
The main difference for households lies within these percentages. Postponing the purchase of electronics is usually easier than daily spending on food. That is why the faster growth of the food group restricts free money more strongly for those whose basket already consists predominantly of essential purchases. At the same time, the group index does not allow the claim that every product rose in price by exactly 6.9%.
Two baskets, two results
A FinFly calculation for two illustrative budgets of 1,000 manats shows the effect of the spending structure. In the first, 60% of spending goes to the food group, 15% to non-food goods and 25% to services. In the second, the proportions are 35%, 25% and 40%. If the September annual indices are applied to them, maintaining the first basket will require approximately 59.6 additional manats, and the second 53.6 manats.
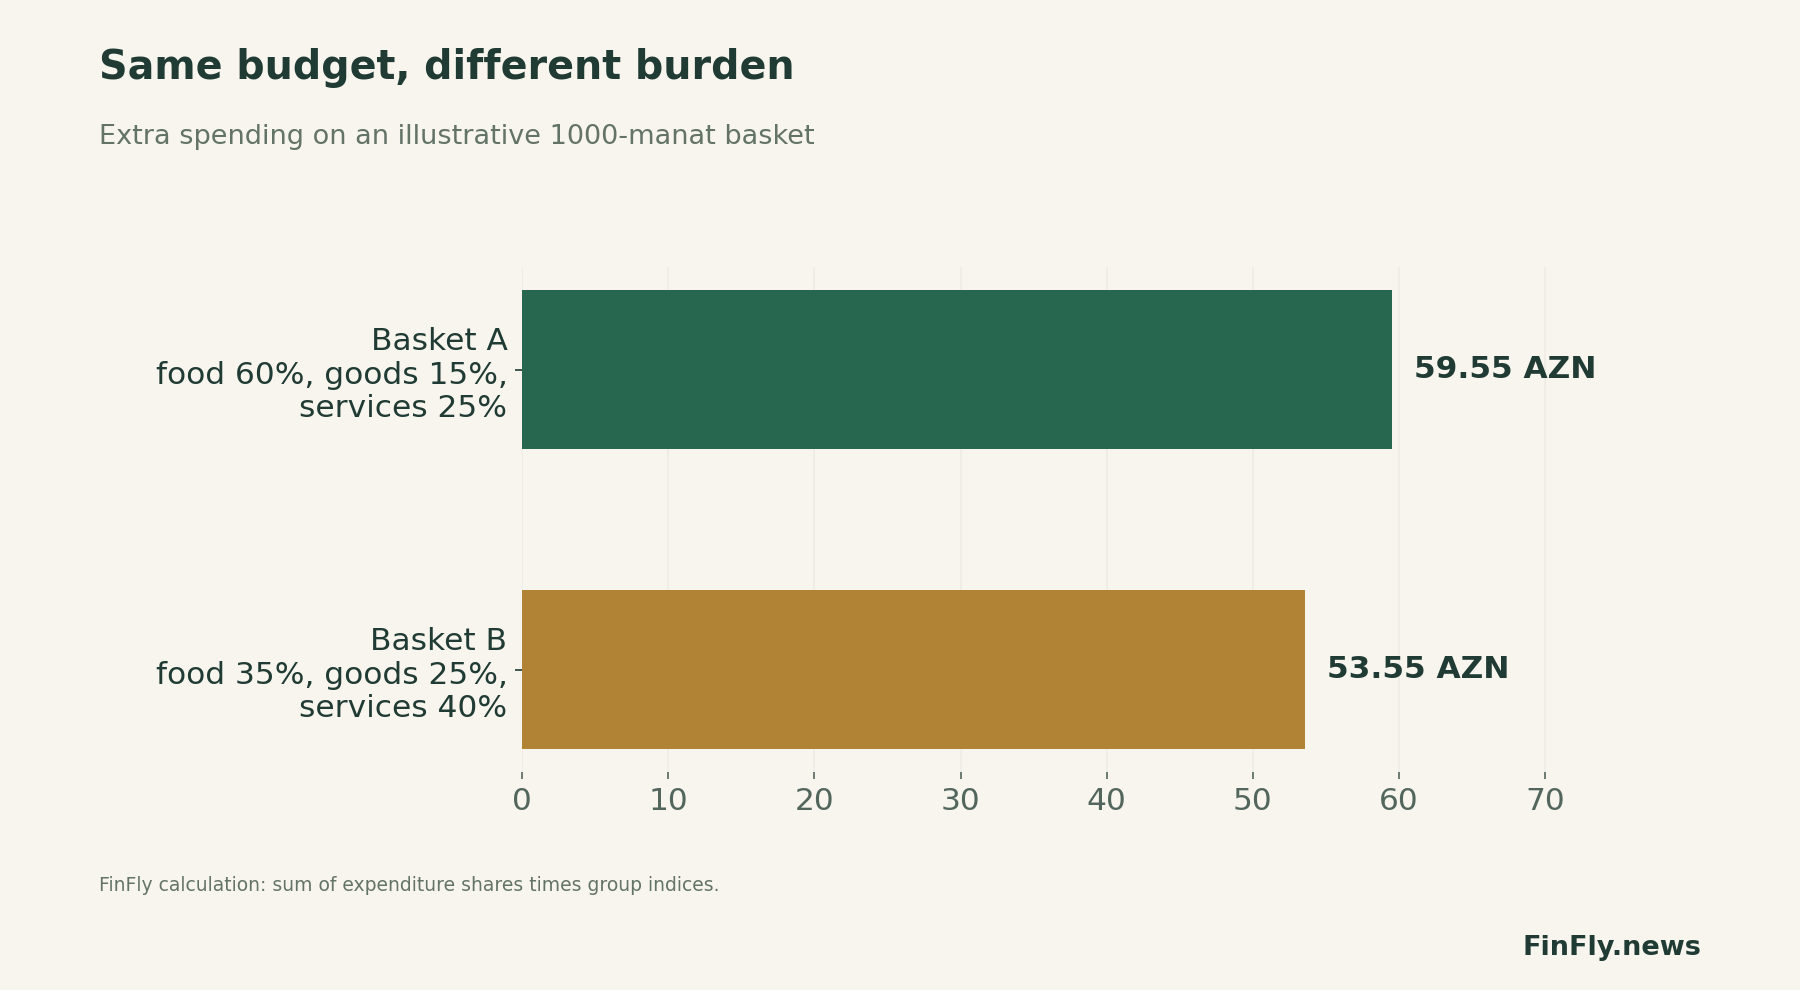
This is a calculation for understanding the mechanism, not a household survey. The food index also includes beverages and tobacco; a renter, a homeowner and a family with medical expenses distribute their money differently. Moreover, within large groups, goods rise in price unevenly. But the example explains why a single inflation figure should not become the answer to any question about the cost of living.
The size of income also matters. A difference of a few manats looks small in overall statistics, but becomes noticeable when mandatory payments already absorb almost all of a person's earnings. A person may keep the same receipt total by switching to cheaper products. Formally, their spending has not increased, yet they are no longer maintaining their previous level of consumption.
Growth in trade does not equal the well-being of every shopper
For January-September, real retail turnover increased by 3.8%. This is a useful signal for business: the market as a whole is expanding even after adjusting for price changes. But the aggregate does not show which households bought more and which cut back on purchases. Growth could have been distributed unevenly across territories, product categories and groups of buyers.
Therefore, it is not enough for a seller to see the market grow and automatically raise the sales plan. Data are needed on the number of purchases, the average transaction value, the share of promotional goods and repeat visits. If monetary revenue grows while the number of units in the basket falls, this is a completely different situation from growth in physical demand. It requires caution with inventories and assortment.
The same applies to incomes. Nominal wage growth cannot be taken as an increase in purchasing power without comparing it with prices over the same period. It is even less correct to apply the average wage to all workers. An average value does not show the distribution of incomes, and a household budget depends both on the number of earners and on dependents.
Where to look for an answer to price pressure
The publication of the index shows the result, but does not establish the cause of each price increase. That requires procurement and import prices, crop yields, transport costs and trade markups. Explaining the entire increase solely by the behavior of shops or solely by external markets without such data would be too convenient and imprecise.
Purchasing power is most strongly constrained by rising spending on basic food products and essential services. The difference between the procurement and retail price, as well as the availability of cheaper alternatives, determines how broad a shopper's choice is. For business, this is a question of sustainable demand. For economic policy, the question is how much money a household has left after mandatory expenses. It is precisely this remainder that determines whether it can save, pay for education and make large purchases.