
At the end of July 2026, cash outside banks (M0) amounted to 19,170.8 million manats, while the M2 monetary aggregate stood at 43,841.8 million manats; both stocks are at the maximums of the available series covering July 2024 to July 2026. The difference is not in the level but in the pace: according to calculations based on Central Bank of Azerbaijan data, the annual growth of M2 was 19.58%, while M0 grew by 15.09%. This is a comparison of two stocks and calculated growth rates over identical periods, not proof of a structural shift in calculations or inflationary pressure.
What exactly the stocks and growth rates show
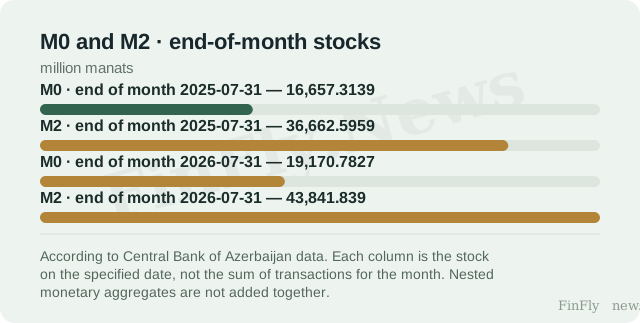
Both series are end-of-month balances, not sums of transactions for the month, so it is correct to compare them as stocks and as calculated growth rates over identical periods. Year on year, M0 grew from 16,657.3 million manats in July 2025 to 19,170.8 million manats in July 2026, i.e., by 15.09%. M2 over the same period increased from 36,662.6 to 43,841.8 million manats, i.e., by 19.58%. The gap in growth rates is the difference between the two stocks, not a measurement of the contribution of individual components of the broad aggregate.
Monthly dynamics add nuance: from June to July 2026, M0 added 0.93%, while M2 added 1.36%. The longer part of the available series shows that both stocks did not grow evenly: in December 2025, M0 stood at 17,947.8 million manats, and M2 at 40,393.7 million manats, noticeably above the January values of the same year (15,285.3 and 34,752.2 million manats, respectively). M0 is included in M2, so these values cannot be added together; they can be compared as stocks and as growth rates.
Why this is not yet a reason to change the procurement budget
A money stock is not payment turnover, not nominal demand, and not volatility of contract prices. If a company is planning a procurement budget, price list, or cash logistics, this comparison alone is insufficient to revise a decision: balances in accounts and cash desks do not measure either the speed of settlements with customers or the structure of payment instruments. A shift between aggregates by itself does not prove a change in payment methods, and an increase in the stock does not prove either a causal effect on prices or a link to the level of interest rates.
The practical boundary of the decision looks like this: if a sustained gap in growth rates were observed, it could be a reason to review requirements for acquiring and cash logistics — but only on the condition that a change in the structure of settlements is confirmed in parallel. There is no such confirmation in the provided data. The limitation here is fundamental: the series covers only July 2024 to July 2026, and the December 2025 jump is a reminder of possible seasonality or one-off factors that cannot be separated from the trend over such a short window.
The observed fact is narrow and specific: at the end of July 2026, the broad aggregate grew faster than the cash component, while both stocks stood at the maximums of the available series. This is a difference in growth rates, not proof of a structural shift in settlements and not evidence of inflationary pressure. The next comparable observation is Central Bank of Azerbaijan data for August 2026: whether the gap in annual growth rates of M2 and M0 persists or cash narrows the lag.