
In August 2026, cash outside banks (M0) amounted to 19,166.77 million manats versus 19,170.78 million a month earlier — a decrease of 4.01 million, or 0.02%. The broad aggregate M2 over the same month rose from 43,841.84 to 44,416.56 million manats, that is, by 574.72 million, or 1.31%. Both indicators are end-of-month stocks, so it is correct to compare stocks on comparable dates. The contrast matters not in itself, but as an indication that the monthly increase in money supply in August 2026 was not accompanied by growth in cash: it was associated with broader components that are not separately disclosed in the provided data.
What exactly the August stocks show
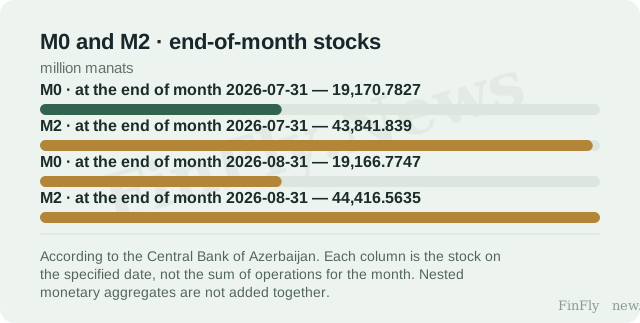
The difference between the two aggregates in August 2026 is the difference between an almost unchanged narrow indicator and a growing broad one. M0 is included in M2, so they cannot be added together: M0 covers only cash outside banks, whereas M2 is broader. It does not follow from this that M2 growth was ensured specifically by non-cash components: the provided data contain no breakdown of M2 into components, and such an interpretation would be a guess rather than an observation. All that is established is that in August 2026 the broad aggregate increased, while cash outside banks did not.
The year-on-year comparison gives a different picture. Since August 2025, M0 rose from 16,828.59 to 19,166.77 million manats — by 2,338.19 million, or 13.89%. M2 over the same period increased from 36,806.17 to 44,416.56 million manats — by 7,610.39 million, or 20.68%. That is, cash outside banks did increase over the year; it is just that their monthly dynamics in August 2026 turned out flat. The August stagnation of M0 is an observation for one month, not a sign of a reversal in the annual trend.
Where the boundary lies for a business decision
For a company that builds its calculations on the assumption of uniform growth in cash turnover, the August data provide no such confirmation. If liquidity growth had come through cash, cash flows and cash revenue would look different than with growth in the broad aggregate. But a money stock is not payment turnover, not nominal demand, and not the volatility of contract prices. Therefore, by itself this contrast does not justify revising the borrowing budget, prices, or the procurement plan: such a decision requires data on actual settlements and financing conditions, which are not present here.
The practical conclusion is conditional. If next month the divergence between flat cash and a growing broad aggregate persists, that will be grounds to separately check how the company's cash flows behave, rather than automatically transferring M2 dynamics onto cash revenue. If M0 returns to growth, the August picture will remain a single observation. In both cases, the decision rests on one's own payment data, and the aggregates serve only as background, not as a substitute for that data.
August 2026 provides one clear contrast: cash outside banks barely changed, while the broad aggregate M2 grew. This does not prove that M2 growth was ensured by non-cash components, and does not explain the causes of the August stagnation of M0. At the same time, the annual rates show growth in both indicators, so the monthly divergence is an observation, not an established structural shift. For business, this means that calculations for cash revenue should be checked separately from the dynamics of the broad aggregate, rather than derived from it.