
Insurance revenue can increase while the economics of an individual contract deteriorate. That is the central analytical issue in IUMI’s October report: changes in rates must be separated from currency translation and the value of the assets being insured.
In its 27 October release, IUMI put worldwide marine premiums for 2025 at $42.6bn, up 5.5% on the previous year, while highlighting price competition and a weaker dollar. These are previous-year statistics published in October 2026, not premium income for the current month.
A larger premium does not necessarily mean a higher rate
Consider an illustrative shipment worth $1m insured at 0.1%. The premium is $1,000. If the same cargo rises in value to $1.2m, an unchanged rate produces a $1,200 premium. The insurer collects 20% more, but the property value at risk also rises by 20%. Insurance has not become more expensive on a like-for-like rate basis.
Now assume the rate falls to 0.09% on the higher cargo value. The premium becomes $1,080: revenue remains 8% above its initial level even though the rate has declined by 10%. Premium growth therefore cannot serve as a ready-made insurance price index. This is a demonstration of the mechanism, not a quotation from an insurer.
Currency translation adds another layer. Unchanged euro-denominated premiums can generate dollar growth when converted for reporting. Translation alone does not give an insurer additional resources to pay a repair bill that is also denominated in euros. A meaningful comparison needs constant-currency data and a consistent mix of risks.
Three segments need different comparisons
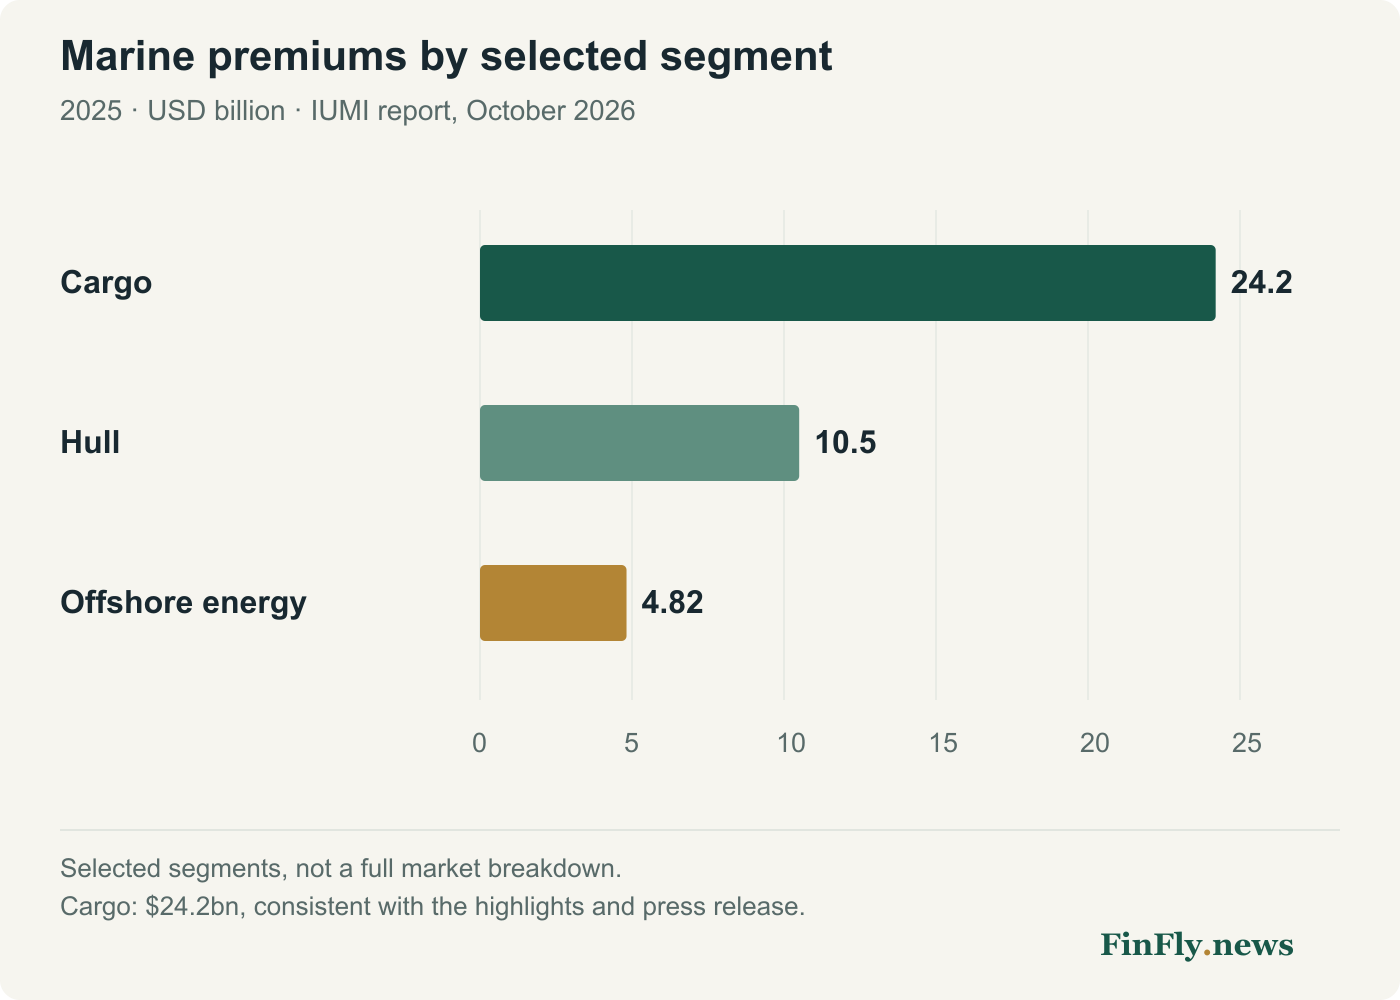
The chart below compares three lines in IUMI’s October summary. They are selected segments rather than an exhaustive breakdown of the global market. Cargo, hull and offshore energy involve different insured objects, loss patterns and settlement timelines.
There is an editorial discrepancy on printed page 18 of the full report: the cargo headline figure is $24.2bn, while the adjacent paragraph says $24.4bn. Our chart uses $24.2bn, consistent with the highlights and later press release. We do not disguise that ambiguity with excessively precise market-share calculations.
The economics of cover extend beyond the price
An exporter comparing offers needs more than the final premium. Identical prices may buy different limits, deductibles and exclusions. A discount accompanied by greater retained exposure is not necessarily an improvement in the offer.
An illustrative calculation makes the trade-off visible. Suppose the premium falls from $10,000 to $8,000 while the per-loss deductible increases from $10,000 to $25,000. The purchase saves $2,000. After one covered $100,000 loss, all else equal, the policyholder receives $15,000 less compensation. This does not establish that the cheaper policy is unattractive: the decision depends on loss probabilities and severity. But premium alone cannot describe it.
| Measure | Option A | Option B |
|---|---|---|
| Premium | 10,000 | 8,000 |
| Per-loss deductible | 10,000 | 25,000 |
| Payment after a 100,000 loss | 90,000 | 75,000 |
| Client cost: premium + deductible | 20,000 | 33,000 |
FinFly calculation. One fully covered loss, adequate limit and no additional restrictions. Inputs and probabilities are not a market estimate.
The implications for businesses in Azerbaijan
For a business shipping through several countries, comparing quotations for the same route and conditions is more useful than applying a global average to its own shipment. The comparison should hold constant the commodity, value, transshipment points, storage periods, per-event limit and the client’s retained share.
Our conclusion is that worldwide premium growth measures the scale of insurance activity. On its own, it demonstrates neither a higher price of protection for a particular exporter nor greater financial resilience at an insurer. The former requires comparable contracts; the latter requires claims, expenses, reinsurance and capital information. Until those checks are made, the growth figure describes volume rather than the quality of protection.