
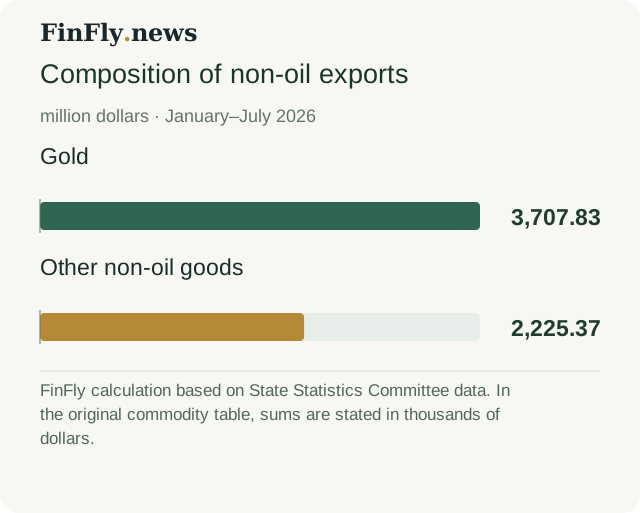
Azerbaijan's non-oil exports reached $5.93 billion in January–July 2026, but almost two-thirds of that sum was provided by a single commodity group — gold. According to a FinFly calculation based on State Statistics Committee tables, its share was about 62.5%. Therefore, growth in non-oil exports by itself does not yet show how widely supplies from other sectors are expanding.
Unwrought and semi-manufactured gold, as well as gold in powder form, accounted for $3.71 billion. Other non-oil goods accounted for about $2.23 billion. These sums were obtained after bringing the tables to a single scale: total exports are stated in millions of dollars, while individual goods are stated in thousands. The 62.5% share refers to the value of non-oil exports over the seven months, not to the country's entire exports and not to its annual growth.
Behind gold — different trends
In the commodity breakdown there is growth unrelated to gold. Supplies of fresh vegetables in January–July increased by 11.1% in value and by 9% in real terms compared with the same period of 2025. Exports of cotton fibre rose by 26.2% in value and by 31.9% in real terms. At the same time, real supplies of mineral fertilisers fell by 37.1%, polypropylene by 14.1%, and polyethylene by 24.2%. Their value decreased by 12%, 11.3% and 20.8% respectively. Behind the large sum with a high share of gold, different — including negative — results of other sectors are visible.
Exports of fresh fruit are also telling: the value of supplies rose by 20.9%, while the real indicator fell by 2.3%. For business, the distinction is fundamental. Growth in the dollar sum does not necessarily mean an expansion in the volume of supplies and in the load on logistics. This table shows the divergence, but does not allow it to be split into changes in the prices of specific fruits and changes in the composition of the export basket. Attributing the result to only one of these factors would be premature.
A surplus is not equal to a general upswing
The same caution is needed when assessing the whole of foreign trade. In January–July its turnover amounted to $30.02 billion, 6.9% more than a year earlier, in nominal terms. At the same time, the State Statistics Committee reported a decline in turnover of 15.1% in real terms. The positive dynamics of the dollar sum and the negative dynamics after removing the price effect describe different sides of trade, rather than contradicting each other.
Total exports reached $20.14 billion: plus 39.1% in value and 11.2% in real terms. Imports amounted to $9.88 billion — a decline of 27.4% and 43% respectively. The difference between the nominal export and import sums for January–July produced a surplus of $10.26 billion. A large positive balance coexists with a contraction in imports. A surplus alone cannot be used to judge either the state of domestic demand or the reasons for changes in the currency market; the real rates of exports and imports also cannot simply be averaged.
The import breakdown does not give a picture of a uniform decline. The value of imports of passenger cars fell by 37.8%, while that of computers, units and devices rose by 25%. The value of gold imports fell by 99.4%. The latter indicator deserves separate attention, but by itself it does not measure gold's contribution to the overall contraction in imports: for that, comparable absolute sums for both years are needed.
What the gold share really says
High concentration does not devalue gold exports and does not cancel out the growth of vegetables or cotton. It shows something else: non-oil statistics are not a ready-made measure of the success of all non-resource industries. A change in large gold shipments can noticeably affect the total sum even if other goods follow a different trend. For an exporter of fertilisers, fruit or polymers, the aggregate indicator is therefore far less informative than its own commodity line.
At the same time, gold exports cannot be equated with domestic extraction. The breakdown examined does not establish the origin of the metal or the presence of re-exports, so there are no grounds for attributing the entire sum to Azerbaijani producers. The conclusion from these data is already sufficiently definite: a high sum of non-oil exports coexists with concentration in a single commodity group, and beyond it — with heterogeneous, rather than uniformly growing, trade. Gold changes the scale of the overall indicator, but does not make it a diagnosis for every industry.