
Azerbaijan's State Statistics Committee records for January–August 2026 a divergence within the consumer basket: prices for the "food, alcoholic beverages and tobacco" group rose by 6.9% compared with the same period last year, while the overall consumer price index rose by 5.7%. This is not merely a breakdown detail. Real sales of the same food group, already adjusted for price changes, increased by only 1.4%, while non-food goods rose by 6.9%. The same period shows: the price of food is rising faster than the overall index, while its physical turnover is growing more slowly than that of non-food goods.
What exactly diverges: price and physical turnover
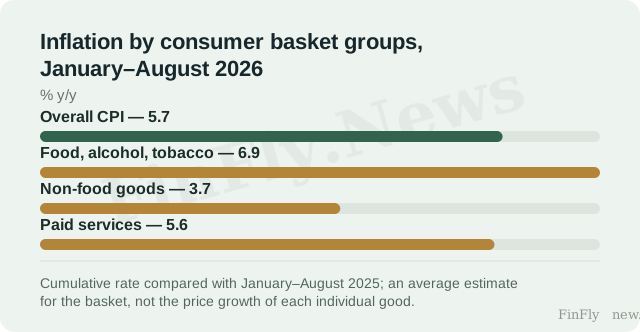
The CPI breakdown for January–August 2026 shows three different rates: food, alcohol and tobacco — 6.9%, paid services to the population — 5.6%, non-food goods — 3.7%, with an overall index of 5.7%. The food group runs above the overall figure, while the non-food group is noticeably below it. These are average estimates for the basket, not the price growth of each individual good, and they refer to the cumulative period, not to a single month.
Retail data for the same period provide the second half of the picture. Real goods turnover grew by 3.9%, while sales of food, beverages and tobacco rose by 1.4%, and non-food goods by 6.9%. Real growth already excludes price effects, so 1.4% is the dynamics of physical volume, not monetary volume. The food group simultaneously leads in price and lags in physical turnover.
Where this changes a business decision
For a food retail operator or supplier, the divergence sets the boundary of the decision. If your own purchase prices for specific items are rising faster than the overall CPI, that is visible only from your data: the State Statistics Committee publishes consumer prices, not purchase prices. Planning assortment, warehouse and staff based on the overall CPI of 5.7% means relying on an indicator that describes neither the price of your group nor its physical demand.
But this observation alone is not enough to change the procurement budget or pricing policy. Inflation is an average across the basket, not the movement of a specific good; real sales growth does not equal demand for your category; the CPI breakdown and retail data describe the period January–August 2026, whereas the overall figure in the January–September 2026 summary refers to the cumulative period and is not broken down by group. A decision requires your own data: the dynamics of your purchase prices and physical volumes for specific items.
The observed fact is narrow and specific: for January–August 2026, food inflation of 6.9% exceeded the overall CPI of 5.7%, while real sales of this group grew by only 1.4%, against 6.9% for non-food goods. This does not prove that the rise in food prices is driven by demand or that households are reducing consumption: real growth remains positive. The practical conclusion is to distinguish the price of the group from its physical turnover, rather than applying the overall index to a specific category.