
The average rate on manat deposits in August 2026 was 9.12% per annum, down 0.16 percentage points from July's 9.28%, but remaining 0.15 points above 8.97% a year earlier. This is not a reversal of the trend, but a pullback within a year of growth: the annual level is higher, the monthly one is lower. For business, what matters more is not the fact of the fluctuation itself, but that the average rate across all maturities and depositors is not equal to the rate on a specific deposit and does not mechanically follow the CBA policy rate, which has been in effect since 5 February 2026 at 6.5%.
What exactly the figures show
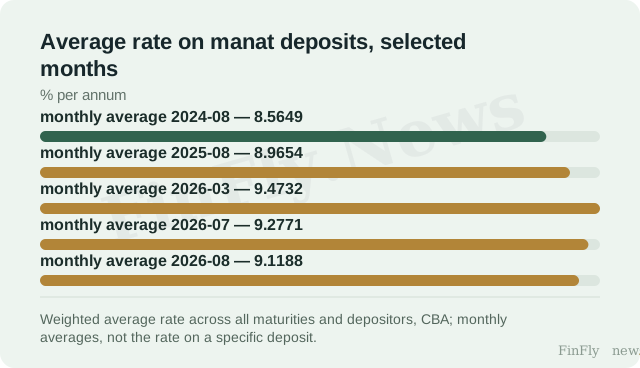
The August value of 9.12% is the weighted average rate on manat deposits of all maturities published by the CBA. The decline from July of 0.16 p.p. and the rise from August 2025 of 0.15 p.p. are FinFly calculations based on official observations. Both movements are small and multidirectional, so it is correct to speak of fluctuation around a level of about 9%, rather than a change of regime. For comparison: in March 2026 the same series showed 9.47%, and in August 2024 — 8.56%, meaning the current value lies between these points.
The CBA policy rate stands apart: 6.5%, in effect since 5 February 2026. The gap between the market deposit rate and the official rate is not an anomaly and not a signal: these are different instruments with different functions. The deposit rate reflects the terms on which banks raise funds from a broad range of depositors; the policy rate is the cost of liquidity from the regulator. Comparing them is useful as a benchmark of scale, but not as proof of a causal link: the data do not imply that the decline in the deposit rate was caused by CBA policy or that it will continue. The source records only the date the rate took effect and its value, but does not confirm that it remained unchanged throughout the entire period under review.
Where this changes a business decision
The practical meaning of the August pullback lies in the boundary of a decision, not in a recommendation. If a company is assessing the cost of future manat funding or the return on placing free funds, the average rate across all maturities does not replace a specific bank offer: it does not account for maturity, amount, type of depositor or early withdrawal terms. Total deposits and placements in credit institutions at the end of July 2026 stood at 44.5 billion manats versus 41.8 billion a year earlier — this is a stock at the end of the period, not a flow of new deposits and not the price of raising funds, so it cannot be compared with the deposit rate as an explanation of its dynamics.
Hence a conditional mechanism: if a bank revises its funding rates following a change in the market average, then, all else being equal, terms on new deposits may shift along with it; but this is precisely a condition, not an observed fact, and it does not carry over automatically to lending pricing. The average rate on manat loans in August 2026 was 15.74% versus 15.22% a year earlier — this is a separate series with its own dynamics, and it cannot be derived from the deposit rate. There is one limitation here: the monthly average across all maturities does not show how rates changed at specific maturities, so it cannot be used to judge a shift in the yield curve.
August 2026 produced not a new trend, but a point within a year of growth: 9.12% versus 9.28% in July and 8.97% a year earlier. For business, this means that the cost of manat funding remains above last year's level, and monthly fluctuations are too small to change a borrowing budget or pricing on their basis. A decision should be tied to a specific bank offer and to one's own horizon, not to the market average.