
The growth in Azerbaijan's average salary has significantly outpaced the increase in its purchasing power. From January to July 2026, the nominal gain was 7.2% compared to the same period last year. After adjusting for consumer prices, only about 1.4% remains, according to a FinFly calculation based on two publications from the State Statistics Committee. This is a positive result, but far smaller than the salary statistics alone might suggest.
The average monthly nominal salary for this period reached 1,176.7 manats. The overall consumer price index rose by 5.7%. FinFly compared January–July with January–July: the salary index was divided by the price index. This calculation takes into account that the very base of purchases became more expensive, so the real gain is slightly less than the simple difference between the two rates. This is an estimate of the purchasing power of the average salary, not of every household's income.
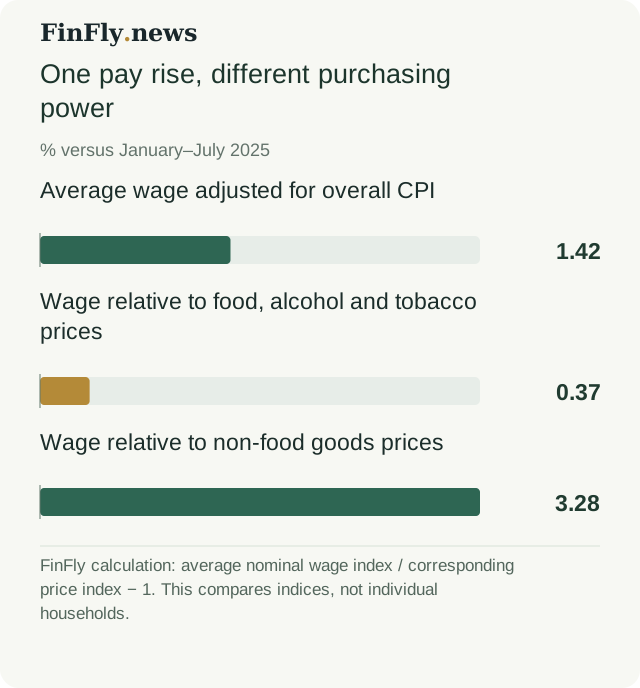
One raise — different purchases
The smallest margin remains in the food group. Food products, alcoholic beverages and tobacco rose in price by 6.8% from January to July compared to the same period in 2025. When compared with this index, the growth in the average salary yields only about 0.4% in additional purchasing power. For non-food goods, whose prices rose by 3.8%, the result is about 3.3%. For paid services, which became 5.7% more expensive, it coincides with the calculation based on the overall price index.
The difference matters for households with different spending patterns. With the same increase in income, someone who spends more on the group whose prices are rising faster will get a smaller benefit from the raise. But the food index includes alcohol and tobacco, and personal purchases do not replicate the statistical basket. Therefore, 0.4% cannot be turned into an estimate of the well-being of a low-income family or a promised raise for a specific worker. Here, the prices of goods and the average salary are being compared, not observations of family budgets.
Retail is growing unevenly
The second cross-section is real sales for the same January–July period. According to the State Statistics Committee, retail turnover increased by 3.8% adjusted for price changes. Sales of food, beverages and tobacco added 1.4%, while non-food goods added 6.6%. This is separate evidence of differences between segments: overall market growth does not describe the situation of every seller. It also does not prove that it was specifically salary increases that drove the gain in sales.
The scale of the categories is also uneven. Textiles, clothing and footwear accounted for 12.5% of the value of all retail sales, electrical goods and furniture for 4.8%, and computers, telecommunications equipment and printed products for only 1.4%. Therefore, the average dynamics of the non-food market combine markets of very different sizes. To assess demand, a supplier is better off looking at its own product group than at the average dynamics of all salaries or all retail. And the sales structure of stores does not replace the budget structure of a particular household.
There is a gain, but it is not shared by all
The weak point of any conclusion about well-being based on these statistics is the average salary. Its growth can come with different outcomes for workers with different incomes; the indicator itself does not say how many people received a raise. It also does not cover all sources of household income. Therefore, a positive result after adjusting for prices does not disprove the personal experience of someone whose salary did not change while essential purchases became more expensive.
For business, the comparison yields a narrower conclusion: an increase in the average salary by itself does not provide grounds to assume a comparable rise in the quantity of goods sold. Prices have already absorbed a significant part of the nominal increase, and real sales differ by category. In the next comparable release, two things are worth watching: whether the positive salary result after the overall CPI holds, and whether the nearly vanished margin relative to the food group widens. For now, the statistics show a small improvement in average purchasing power, not a uniform consumer upswing.