
Connecting power systems more closely can lower costs and improve reliability. Additional lines, digital systems and market arrangements also require investment. Maximum technical integration is therefore not automatically the strongest economic option.
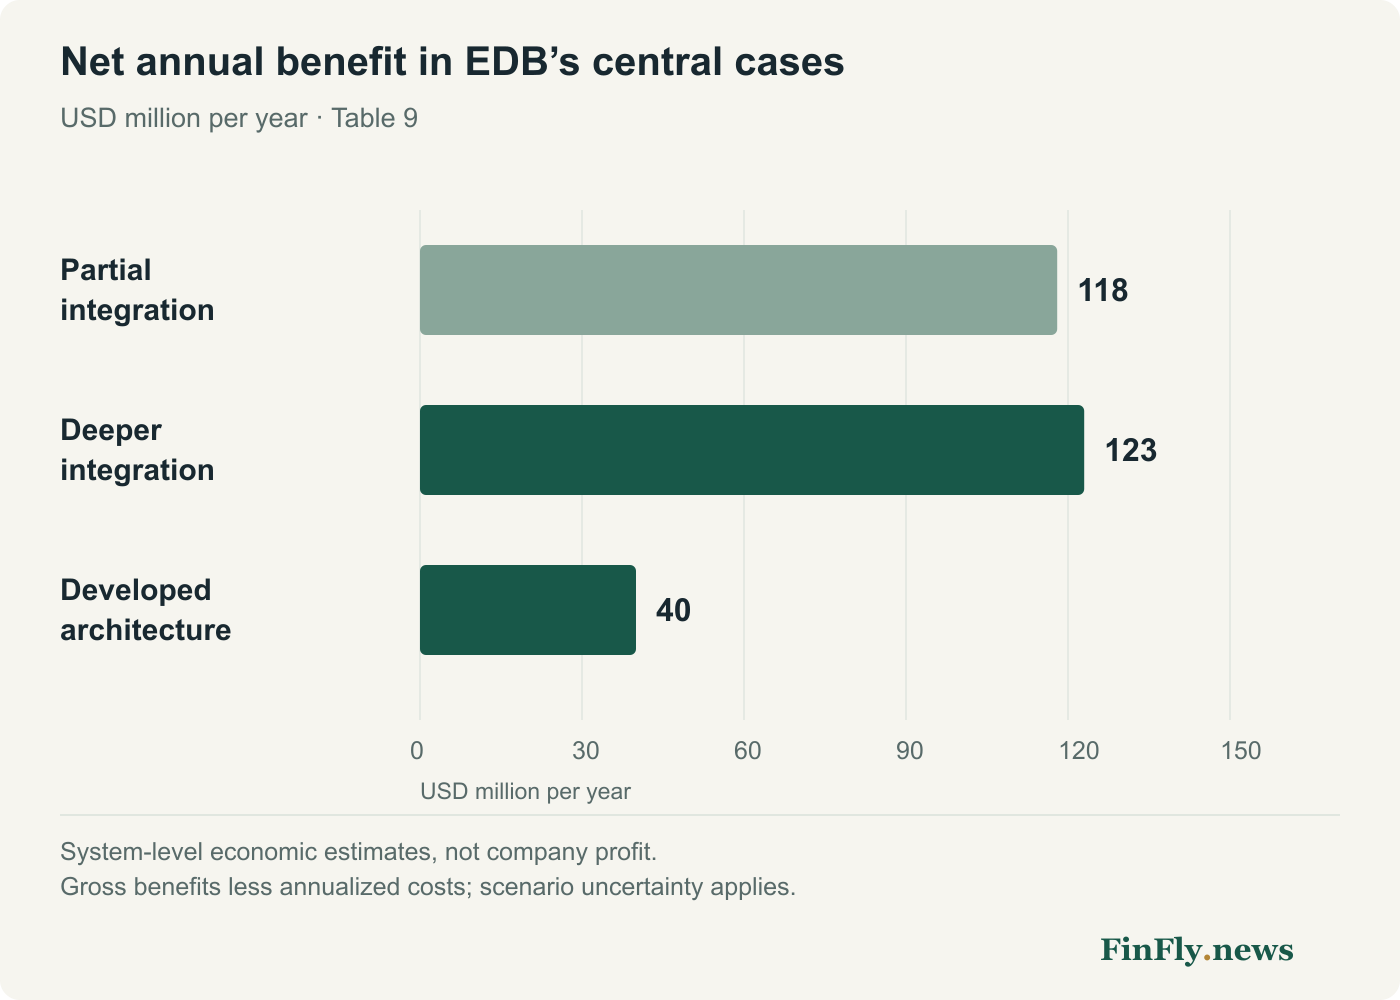
Table 9 of EDB’s Energy Without Borders report illustrates the distinction. Central-case annual net benefits are $118 million for partial integration, $123 million for deeper integration and $40 million for a developed regional architecture. These are preliminary system-level scenarios, not forecasts of company profits.
Gross benefits and net outcomes move differently
As the architecture expands, gross annual benefits rise from $193 million to $640 million. Annualized costs increase from $75 million to $600 million. The latter measures the integration portfolio’s cost on an annual-equivalent basis; it is not simply operating expenditure.
Moving from partial to deeper integration adds about $205 million of gross benefits and $200 million of annualized costs. Moving to the developed architecture adds a further $242 million of benefits and $325 million of costs. FinFly calculated these differences from EDB’s central values.
Comparisons must use a consistent scenario
The report’s introductory infographic cites up to $120 million of net benefits for the developed architecture. Table 9 instead gives a central result of $40 million: $640 million less $600 million. Our comparison uses the single table with disclosed costs rather than substituting the summary’s figure.
Interpreting the introductory estimate requires clarification from the authors. The discrepancy does not prevent checking the main table’s arithmetic, but the two figures should not be merged into one forecast or the larger one treated as assured income.
| Measure | Partial | Deeper | Developed |
|---|---|---|---|
| Gross benefit | 193 | 398 | 640 |
| Annualized cost | 75 | 275 | 600 |
| Net benefit | 118 | 123 | 40 |
| Net benefit with benefits 25% lower | 70 | 25 | -120 |
EDB Tables 9 and 38a; rounded values. The final row is a sensitivity test at central costs, not a forecast.
Execution becomes increasingly important
EDB calculates that the developed architecture must realize about 94% of its central gross benefits to cover central costs. The thresholds are about 39% for partial and 69% for deeper integration. A smaller cushion makes the result more dependent on utilization and effective coordination.
If benefits are one quarter below the central estimate, the developed architecture produces a negative net result of $120 million a year. This is a sensitivity test, not a prediction of losses. It demonstrates why construction sequencing, commissioning and evidence of actual savings matter.
Sequence matters more than program size
Measuring and improving existing interconnections, establishing settlement discipline and testing demand for cross-border services can provide evidence for subsequent investment. Early-stage results help distinguish necessary reinforcement from capacity likely to remain underused.
System-wide savings are also different from a transit country’s revenue. Payments between participants may redistribute benefits without adding to the regional total. For Azerbaijan’s energy-corridor assessment, this calls for two models: overall economic feasibility and each participant’s own revenues, costs and obligations.