
The improvement in youth unemployment deserves a second look. Azerbaijan’s unemployment rate among 15–29-year-olds fell from 9.1% to 8.4% in 2025. Yet the number employed also declined, from 1.1795 million to 1.0855 million. Reading only the unemployment percentage would miss a change of 94,000 people.
We compared the tables in Youth of Azerbaijan 2026. Publication year and observation period must be separated: the yearbook was issued in 2026, while these labour-market figures relate to the ends of 2024 and 2025. They are not an estimate for October 2026.
Both the numerator and denominator changed
| Ages 15–29, thousand people | End-2024 | End-2025 | Change |
|---|---|---|---|
| Labour force | 1 297.6 | 1 184.5 | −113.1 |
| Employed | 1 179.5 | 1 085.5 | −94.0 |
| Unemployed | 118.1 | 99.0 | −19.1 |
The unemployment rate measures unemployed people as a share of the labour force, not all young people. The labour force includes those employed and those meeting the unemployment criteria. Among 15–29-year-olds, it declined from 1.2976 million to 1.1845 million, a reduction of 113,100. Unemployment fell by 19,100 and employment by 94,000.
That combination allows the unemployment rate to fall alongside employment. There is no statistical contradiction. But saying “94,000 young people lost their jobs” would also be wrong: these are group counts at two dates, not a panel tracking the same individuals.
Some people age out of the category while others enter it. Education, migration and participation in job search may also affect its size. The comparison does not separate their contributions, so none can be asserted as the established cause of the decline.
The difficult transition is at ages 20–24
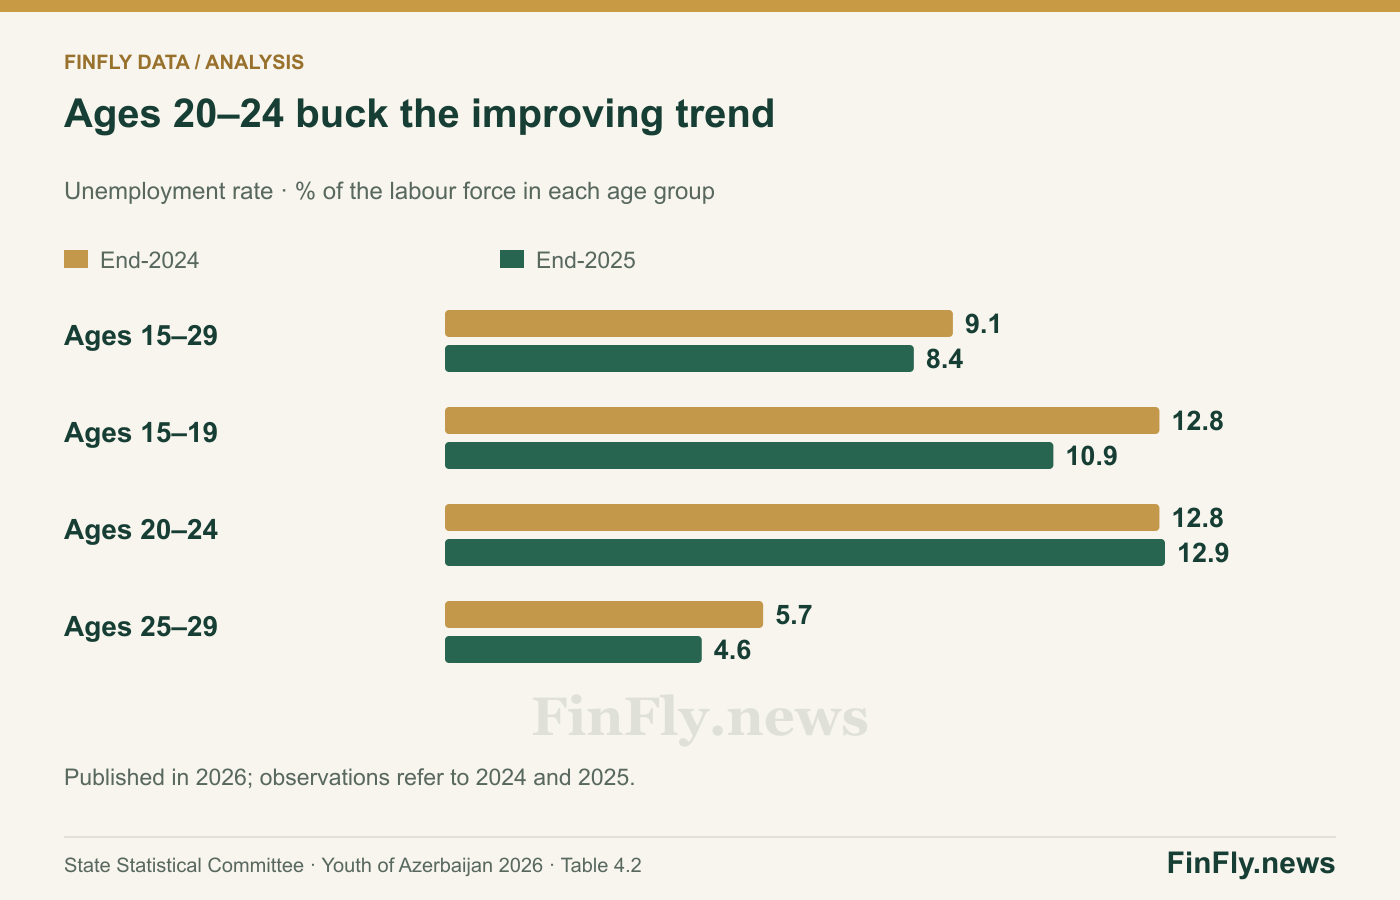
The overall improvement is uneven. Unemployment among 20–24-year-olds edged up from 12.8% to 12.9%, while the rate for 25–29-year-olds fell from 5.7% to 4.6%. The 20–24 group contained 58,700 unemployed people: approximately 59% of unemployed youth, despite representing about 38% of the youth labour force.
Within that age group, unemployment was 11.7% among men and 14.1% among women. The difference helps identify where school-to-work transitions need closer examination. It does not, by itself, establish a cause or measure discrimination.
More students are not evidence of better graduate outcomes
The yearbook’s education tables show higher-education enrolment rising from 246,529 at the start of the 2024/25 academic year to 261,551 in 2025/26, up 6.1%. That expansion matters, but it concerns a different population and reporting dates. It cannot directly explain the change in the 15–29 labour force.
To connect education and employment, the better evidence would follow graduates: time to a first job, whether work matches qualifications and the stability of employment. Total student enrolment answers none of those questions.
We would read unemployment alongside employment and labour-force participation. Employers and education programmes should pay particular attention to the 20–24 transition. In that group, the aggregate improvement has not yet become a lower unemployment rate. One optimistic national headline is therefore not enough.