
Claims payments rose faster than premiums in both major segments of Azerbaijan’s insurance market over nine months. Life insurers paid AZN 92.4 for every AZN 100 of premiums, compared with AZN 42.1 among other insurers. FinFly calculated the ratios from the CBA’s company-level January-September figures for 2025 and 2026.
Life insurance accounts for the larger shift
Five active life insurers collected AZN 704.5 million and paid AZN 650.7 million. Premiums increased 7.5%, while claims payments rose 34.3%. The payments-to-premiums ratio increased from 73.9% to 92.4%, a gain of 18.4 percentage points. Among the other ten insurers, payments grew 17.2% against premium growth of 10.1%, lifting the ratio from 39.5% to 42.1%.
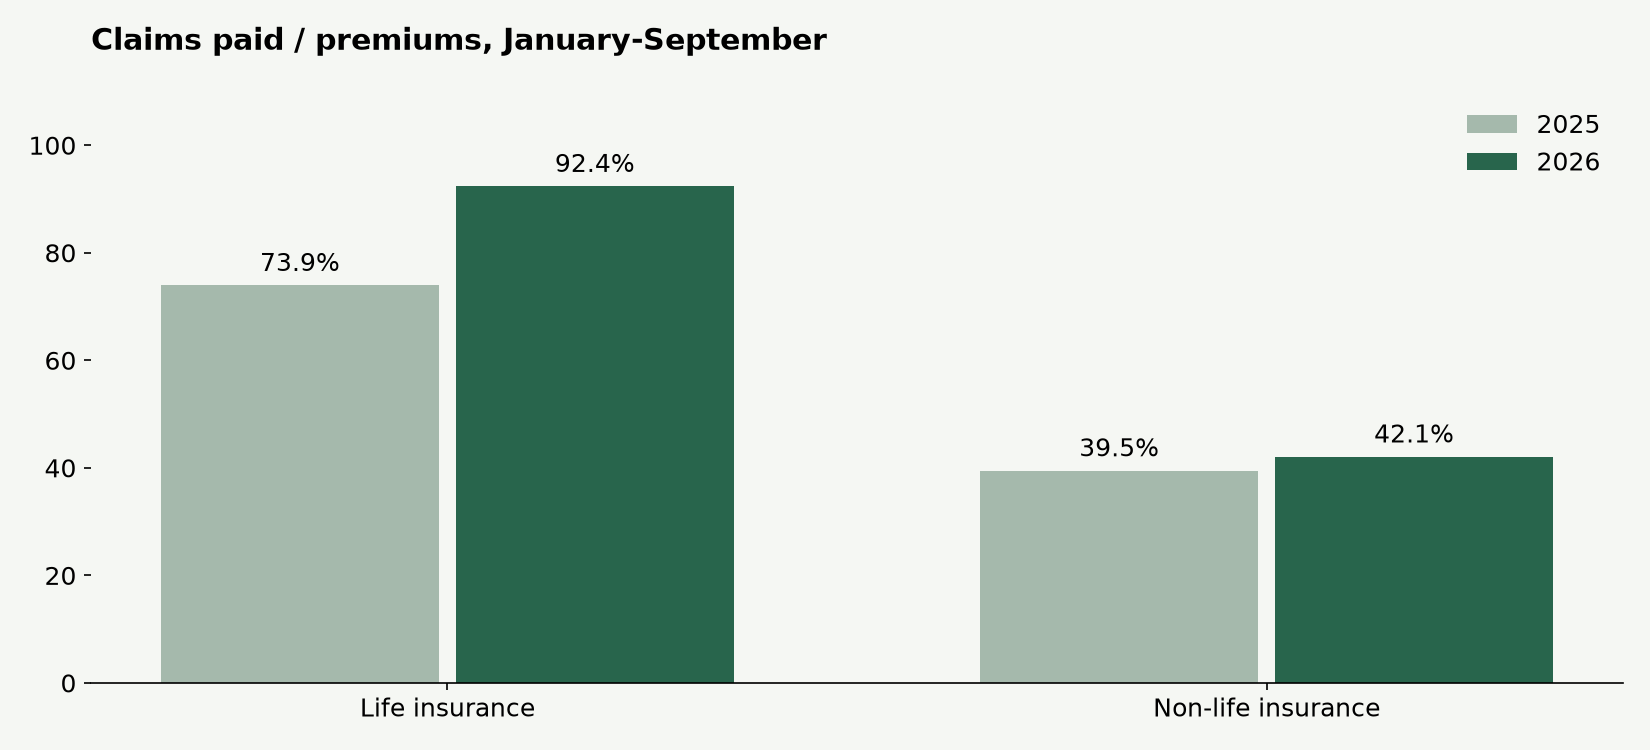
Life insurers: payments approach premium income
Companies are ranked by payments divided by premiums, not financial strength. Growth rates compare the same nine-month period in each year.
| Company | Premiums, AZN m | Claims, AZN m | Claims / premiums | Premium change | Claims change |
|---|---|---|---|---|---|
| Atəşgah Həyat | 83.58 | 87.75 | 105.0% | +3.0% | +84.7% |
| PAŞA Həyat | 568.35 | 548.53 | 96.5% | +7.1% | +28.4% |
| Xalq Həyat | 9.71 | 3.56 | 36.7% | +15.6% | -12.6% |
| Meqa Həyat | 22.76 | 7.06 | 31.0% | +84.4% | +83.3% |
| Qala Həyat | 20.13 | 3.81 | 18.9% | -11.5% | +76.4% |
Atəşgah Həyat and PAŞA Həyat drive the change
Atəşgah Həyat paid roughly AZN 4.2 million more than it collected in current premiums. PAŞA Həyat’s payments increased AZN 121.5 million and reached 96.5% of premium income. It accounted for approximately 73.1% of the combined increase in payments by the five life insurers. One large portfolio therefore has a substantial effect on the segment total.
Non-life insurers show a wide range
The ten active non-life insurers collected AZN 544.0 million and paid AZN 228.7 million. Specialisation matters even within this group: medical, agricultural and large-risk insurance have different payment patterns.
| Company | Premiums, AZN m | Claims, AZN m | Claims / premiums | Premium change | Claims change |
|---|---|---|---|---|---|
| A-Qroup | 11.18 | 9.71 | 86.9% | +0.2% | +17.8% |
| Azərbaycan Sənaye Sığorta | 19.78 | 14.04 | 71.0% | -20.1% | +55.9% |
| Atəşgah | 69.16 | 32.00 | 46.3% | +42.1% | +8.6% |
| Meqa Sığorta | 27.26 | 12.51 | 45.9% | +6.1% | +5.7% |
| PAŞA Sığorta | 308.93 | 130.90 | 42.4% | +13.2% | +27.1% |
| Xalq Sığorta | 22.10 | 7.84 | 35.5% | +7.6% | +2.6% |
| Qala Sığorta | 52.58 | 18.00 | 34.2% | -17.7% | -7.2% |
| AzSığorta | 5.88 | 1.45 | 24.7% | -7.5% | +6.4% |
| Aqrar Sığorta | 20.48 | 1.89 | 9.2% | +30.1% | -61.9% |
| İpək Yolu | 6.61 | 0.40 | 6.1% | +47.2% | +82.9% |
Two contrasting trajectories
Azərbaycan Sənaye Sığorta’s premiums fell 20.1% as payments rose 55.9%. Aqrar Sığorta moved in the opposite direction: premiums increased 30.1% and payments declined 61.9%. These changes describe period cash flows. They neither explain individual claims decisions nor measure refusal rates.
Why this is not a service-quality ranking
Life-insurance payments can include maturities of savings contracts sold in earlier years, while premiums come from existing and new contracts. A ratio above 100% does not establish insolvency. A low ratio does not establish poor service either: risk mix, contract duration and settlement timing matter. Profitability requires expenses, reserves, reinsurance and investment results, which this table does not provide.
Scope of the calculation
The sample covers 15 active insurers. Revoked-licence rows are excluded from both years to keep company coverage consistent. Source figures in thousands of manats are converted to millions. Payments are divided by premiums for the same period; this is not an actuarial loss ratio based on incurred claims and earned premiums.


