
Payouts are growing faster than premiums
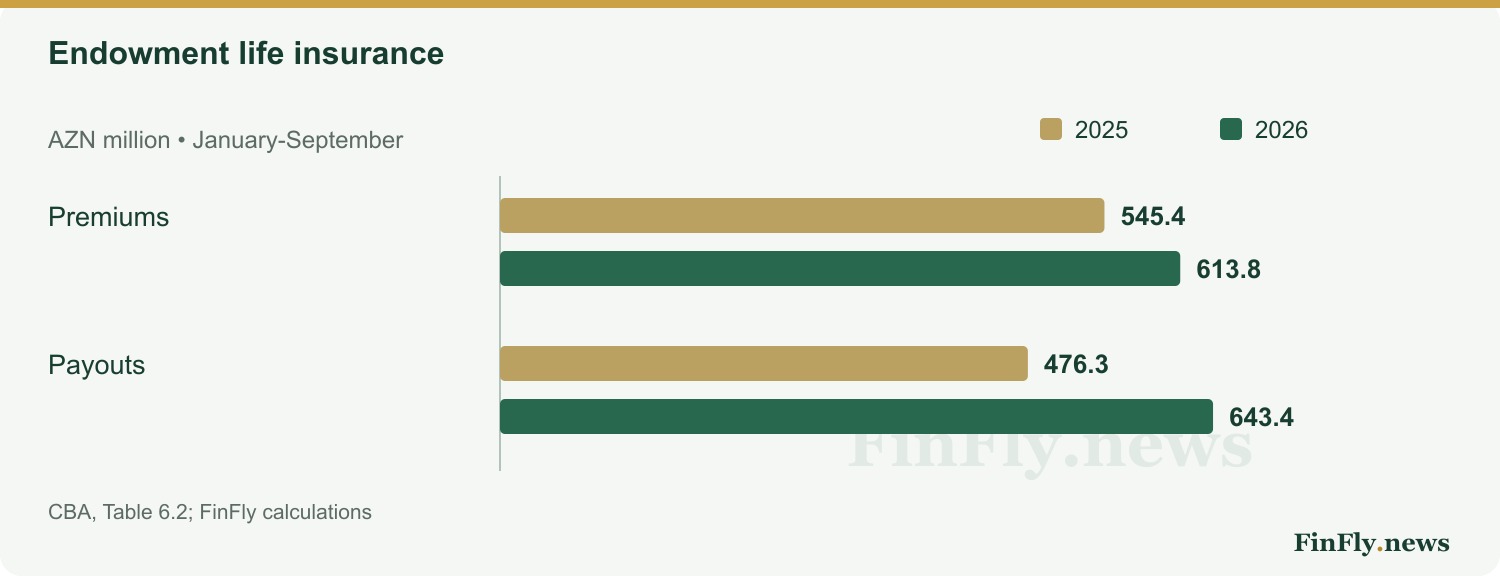
Azerbaijan’s endowment life insurance segment paid AZN 643.4 million in January-September 2026 while collecting AZN 613.8 million in premiums, a difference of AZN 29.6 million. FinFly’s calculation uses the “həyatın yaşam sığortası” line in the CBA’s insurance-by-class table. This is a specific insurance class, not the entire life market.
In the same nine months of 2025, premiums were AZN 545.4 million and payouts AZN 476.3 million. Premiums increased 12.5%, while payouts rose 35.1%. New inflows are therefore not falling; they are growing more slowly than payments.
A ratio above 100% is not an accounting loss
Payments amounted to roughly AZN 1.05 for every manat of premiums during the reporting period, compared with AZN 0.87 a year earlier. Those flows need not relate to the same contracts. New policies can bring in premiums while contracts written several years earlier generate payouts.
For an endowment product, maturity can be a scheduled contractual obligation rather than an insured accident. The 104.8% payouts-to-premiums ratio therefore establishes neither an accounting loss nor a shortage of cash. The table does not provide the investment income, reserve movements and expenses needed to assess profitability.
A wave of earlier contracts reaching maturity is one possible explanation for faster payments. But the aggregate figures do not break down policy vintages, maturity payments and early surrenders. Treating that explanation as an established cause would go beyond the evidence.
| Measure | 2025 | 2026 |
|---|---|---|
| Premiums | 545.4 | 613.8 |
| Payouts | 476.3 | 643.4 |
| Payouts / premiums | 87.3% | 104.8% |
The next checks concern contracts and liquidity
Customers need to examine contract duration, early-exit conditions, surrender value and payment procedures alongside the promised benefit. Market-wide statistics cannot replace a review of an individual insurer’s terms.
For the sector, the next analytical step is to compare payments with the liability schedule and liquid assets. A maturity peak backed by reserves can make payouts above current premiums a normal phase of the product cycle. Deteriorating liquidity would imply a different assessment. The September table identifies changing flows but cannot distinguish between those scenarios.
Cover: an AI-generated editorial illustration by FinFly.news.