
August’s expansion in business lending was concentrated in large companies. Outstanding business credit rose by AZN 489.9 million during the month to AZN 17.82 billion. Large firms accounted for approximately AZN 420.1 million of the increase, or 85.8%. The rounded 86% refers to the change in outstanding balances, not their share of newly approved loans.
We calculated each group’s contribution using the Central Bank’s business-portfolio breakdown at 31 July and 31 August 2026. This reveals a concentration of monthly growth that the sector-wide headline does not show.
Four groups, different paths
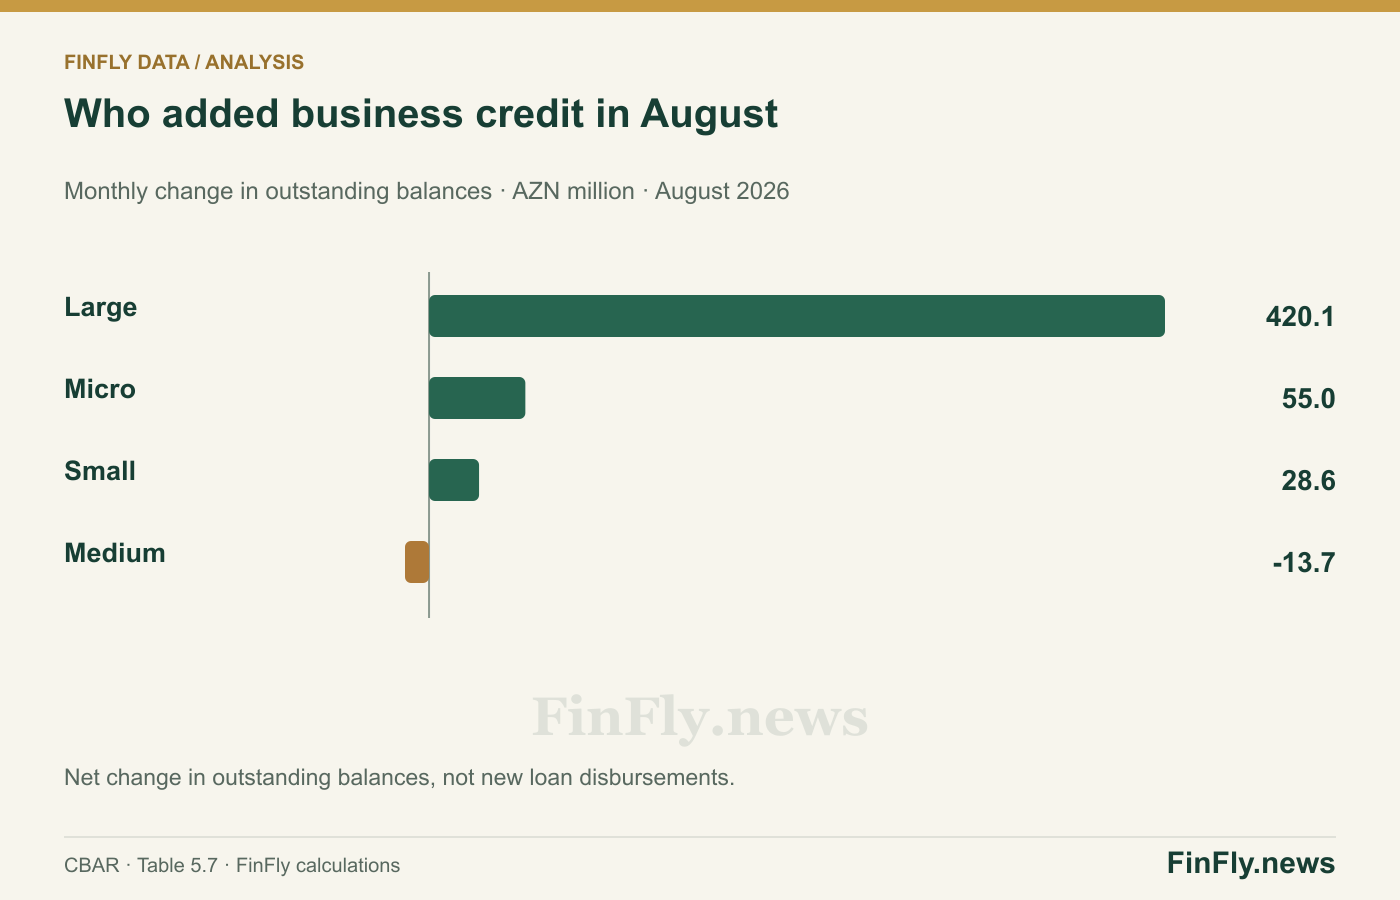
Large businesses held 54.4% of the portfolio, or AZN 9.69 billion. Micro enterprises accounted for 22.0%, or AZN 3.93 billion; medium enterprises for 13.2%, or AZN 2.35 billion; and small enterprises for 10.4%, or AZN 1.86 billion. Micro, small and medium enterprises together still represented about 45.6% of outstanding business loans. August’s growth distribution does not mean banks stopped financing smaller firms.
Within the month, however, the contrast was significant. Micro-enterprise balances increased by roughly AZN 55.0 million, while small-business balances rose by AZN 28.6 million. The medium-enterprise portfolio declined by AZN 13.7 million, moving against the overall trend.
The annual comparison is less stark. Relative to August 2025, large-company credit grew 20.6%, small-company credit 18.1%, micro-enterprise credit 17.3% and medium-company credit 10.0%. All four categories were above their year-earlier levels. A single month shows a shift in growth contributions, not necessarily a lasting change in credit policy.
Loan balances do not measure access by themselves
A reporting-date balance reflects new disbursements, repayments and other changes in carrying amounts. It can shrink while banks are still making loans if existing borrowers repay faster. It can rise because of a few large transactions. The table does not disclose how many applications were approved or rejected.
Nor can we judge distribution simply by comparing the credit share with the number of enterprises. A factory, a retail chain and a workshop have different working-capital and investment needs. Meaningful comparisons require similar industries, maturities and collateral, alongside borrower counts.
The spreadsheet uses the official classification of micro, small, medium and large enterprises. We retain those categories. A business that seems small in everyday language may not have the same status under the statistical classification.
The next test is new lending and borrower numbers
For SME-support programmes, the August figures make medium-sized enterprises worth examining separately. Did their falling balance coincide with fewer new borrowers and disbursements, or with faster debt repayments? Those explanations would call for different responses.
For an entrepreneur, sector-wide credit growth does not guarantee a better offer. The useful comparisons are the total cost, maturity, collateral requirements and repayment schedule of equivalent products. Our finding is a concentration of net portfolio growth, not proof that small businesses have been shut out. Testing access requires borrower and new-contract statistics alongside the money outstanding.