
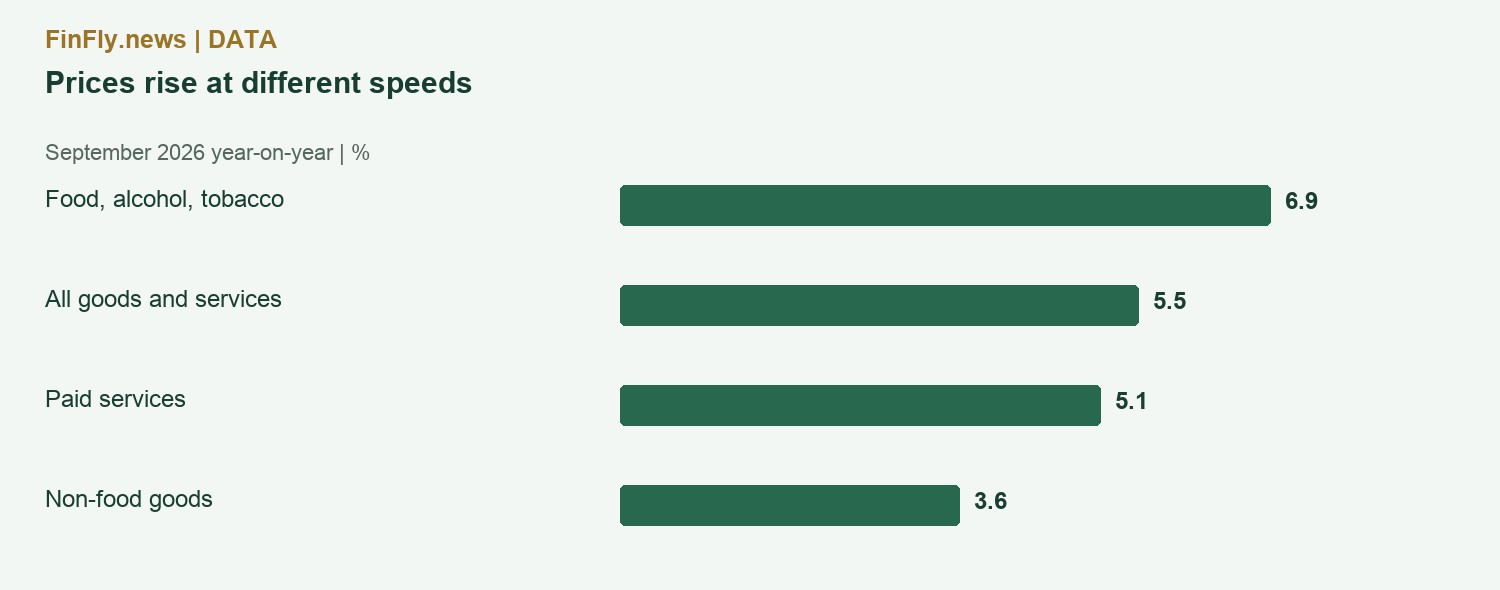
The food group rose 6.9% year on year in September, against headline inflation of 5.5%. The impact on household expenditure varies with the composition of consumption.
Price dynamics by expenditure group
The September figures cited by the CBA show annual headline inflation of 5.5%. Food, alcoholic beverages and tobacco rose 6.9%, paid services 5.1% and non-food goods 3.6%.
The gap between the first and last groups is 3.3 percentage points. A shopper mainly paying for groceries and recurring services therefore faces a different spending pattern from someone whose budget contains a larger share of non-food purchases.
Consumption structure and household costs
The index combines many items using expenditure weights. It cannot be reproduced by taking a simple average of these three rates. Without the weights, the contribution of each group to the headline figure cannot be calculated either.
Comparing receipts with last year works best with the same quantities and quality. If a family buys less or switches to cheaper brands, modest growth in spending can conceal reduced consumption. Stable expenditure may therefore coexist with lower consumption volumes or changes in product quality.
| Measure | Annual increase |
|---|---|
| Headline inflation | 5.5% |
| Food, alcohol and tobacco | 6.9% |
| Paid services | 5.1% |
| Non-food goods | 3.6% |
| Core inflation | 4.9% |
Implications for retail trade
Higher prices do not translate into an equal increase in profit. Some customers reduce quantities; others wait for promotions. Revenue needs to be read alongside sales volumes, purchasing costs and operating expenses to understand the condition of a retail business.
Core inflation was 4.9% in September, below the headline measure. It provides another view of price pressure but does not replace a household’s own basket. Assessments of purchasing power should consider price changes across major household expenditure categories alongside the headline index.