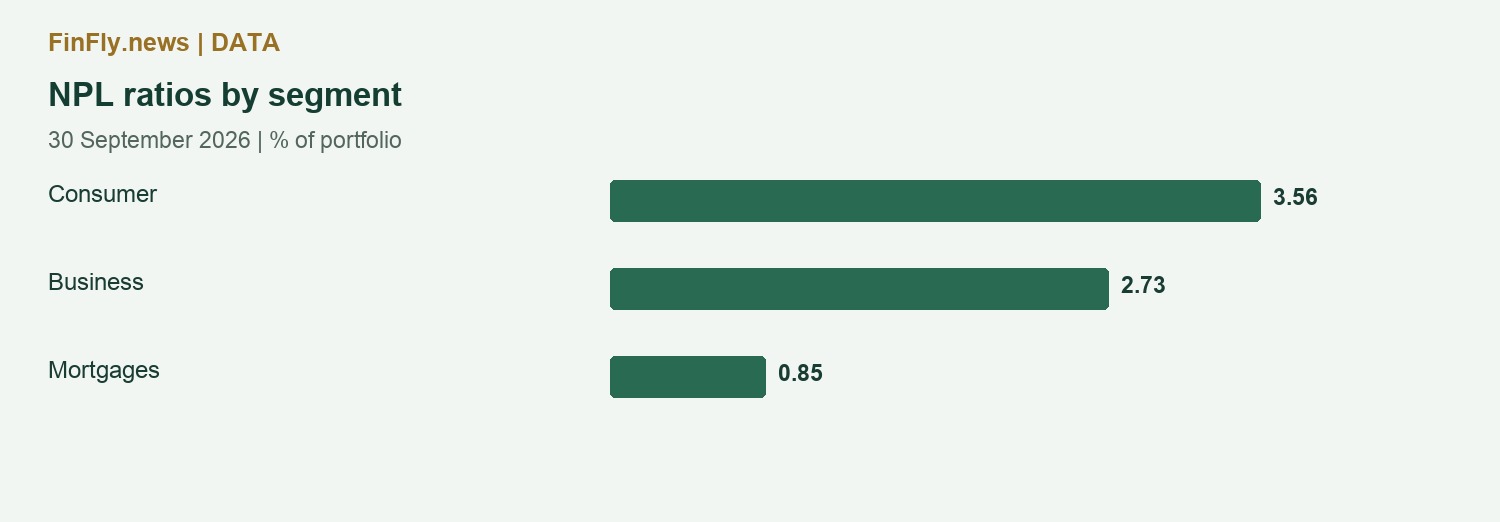
Consumer lending had a 3.56% NPL ratio at end-September. Business lending was lower, while mortgages retained the smallest ratio despite rising bad debt.
The size of the problem versus its share
The CBA prudential tables 5.4 and 5.6 report AZN 503.4 million in business NPLs, AZN 371 million in consumer NPLs and AZN 41.1 million in mortgage NPLs. Business lending leads in absolute value.
The ranking changes after adjusting for portfolio size: the consumer NPL ratio is 3.56%, business lending 2.73% and mortgages 0.85%. Comparing amounts alone obscures different lending volumes.
Mortgages moved against the monthly trend
Business NPLs fell about AZN 14.7 million in September and consumer NPLs declined AZN 17.8 million. Mortgage NPLs instead increased AZN 1.25 million. Against AZN 29.1 million at end-2025, the mortgage bad-loan balance is now about 41% higher.
The mortgage NPL ratio remains low against a portfolio of AZN 4.84 billion. This is the least impaired of the three segments on this measure, but its direction warrants attention. A low level of risk can coexist with a rising problem balance.
| Segment | Loans, AZN billion | NPLs, AZN million | NPL ratio |
|---|---|---|---|
| Business | 18.44 | 503.4 | 2.73% |
| Consumer | 10.41 | 371.0 | 3.56% |
| Mortgages | 4.84 | 41.1 | 0.85% |
What the comparison cannot establish
These are portfolio statistics, not the default probability of an individual new borrower. Loan maturity, collateral, income and repayment history differ across segments.
Business and consumer lending provided the main September improvement. The next mortgage reading will show whether its problem balance continues to rise or whether the latest increase was a monthly fluctuation.