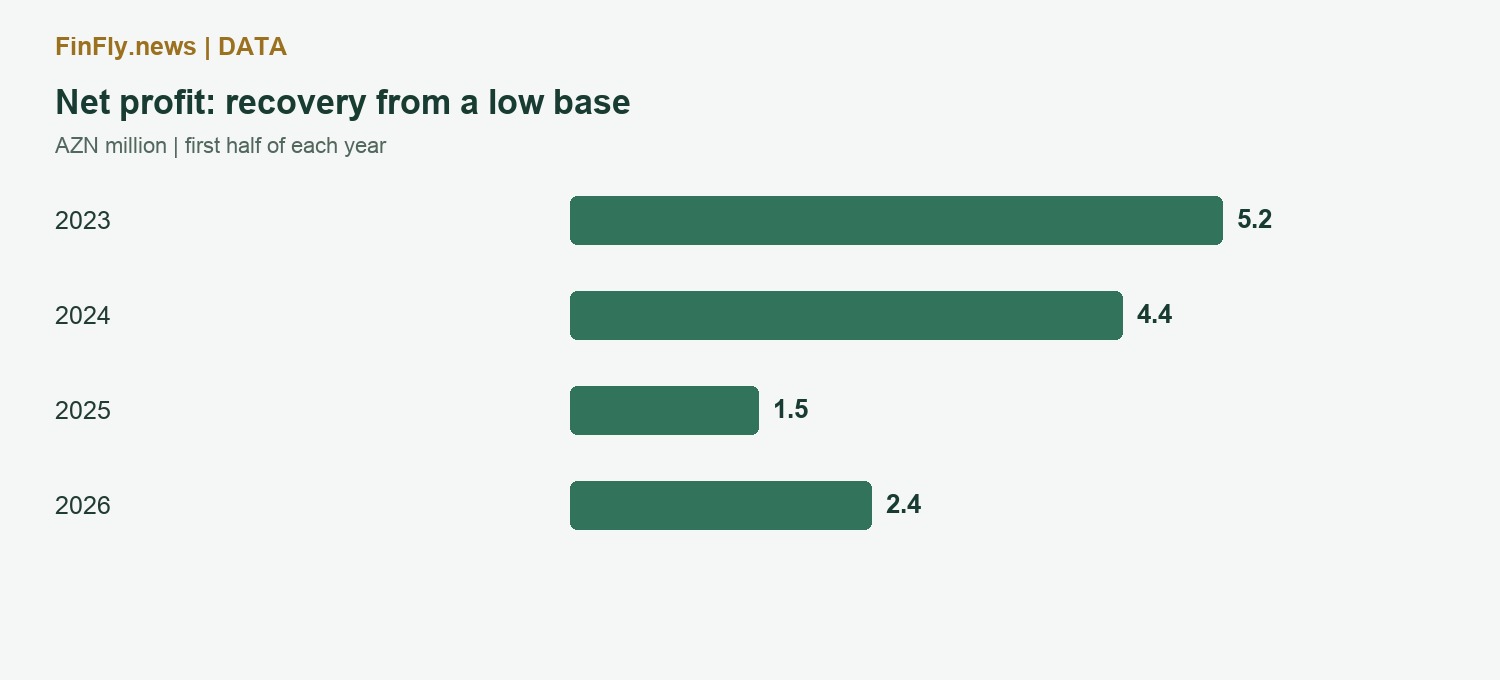
First-half sector profit rose to AZN 2.4 million as income outpaced expenses. Earnings nevertheless remained below the comparable 2023 and 2024 levels.
Putting 60% profit growth in context
The CBA investment-company profitability chart shows first-half 2026 income of AZN 24.8 million and expenses of AZN 22.3 million, against AZN 22.2 million and AZN 20.8 million a year earlier. Net profit rose from AZN 1.5 million to AZN 2.4 million.
Using rounded figures, income increased about 11.7% and expenses 7.2%. Slower cost growth left more room for profit. Rounded income minus expenses does not exactly reconcile to reported net profit, so the separate CBA profit figure is used for the bottom line.
Recovery is not a record
First-half net profit stood at AZN 5.2 million in 2023, AZN 4.4 million in 2024 and AZN 1.5 million in 2025. The latest AZN 2.4 million result represents a recovery, but remains substantially below the first two periods.
The CBA’s reported return on equity increased from 5.4% to 8.9%. The comparable figures were 25.5% in 2023 and 18.3% in 2024. A strong percentage rebound from a low profit base is not the same as restoring earlier efficiency.
| H1, AZN m / % | 2023 | 2024 | 2025 | 2026 |
|---|---|---|---|---|
| Income | 17.4 | 20.3 | 22.2 | 24.8 |
| Expenses | 12.2 | 15.9 | 20.8 | 22.3 |
| Net profit | 5.2 | 4.4 | 1.5 | 2.4 |
| ROE, % | 25.5 | 18.3 | 5.4 | 8.9 |
What supports income
The regulator highlights income from client orders and portfolio management, but provides no revenue breakdown between these services in this section. It is therefore not possible to identify the principal contributor to the increase.
Expenses still represent a large share of income: approximately 89.9%, against 93.7% a year earlier, using rounded figures. This is FinFly’s calculation from the reported totals, not a separate regulatory ratio. Further improvement depends on generating additional income without a matching increase in costs.