
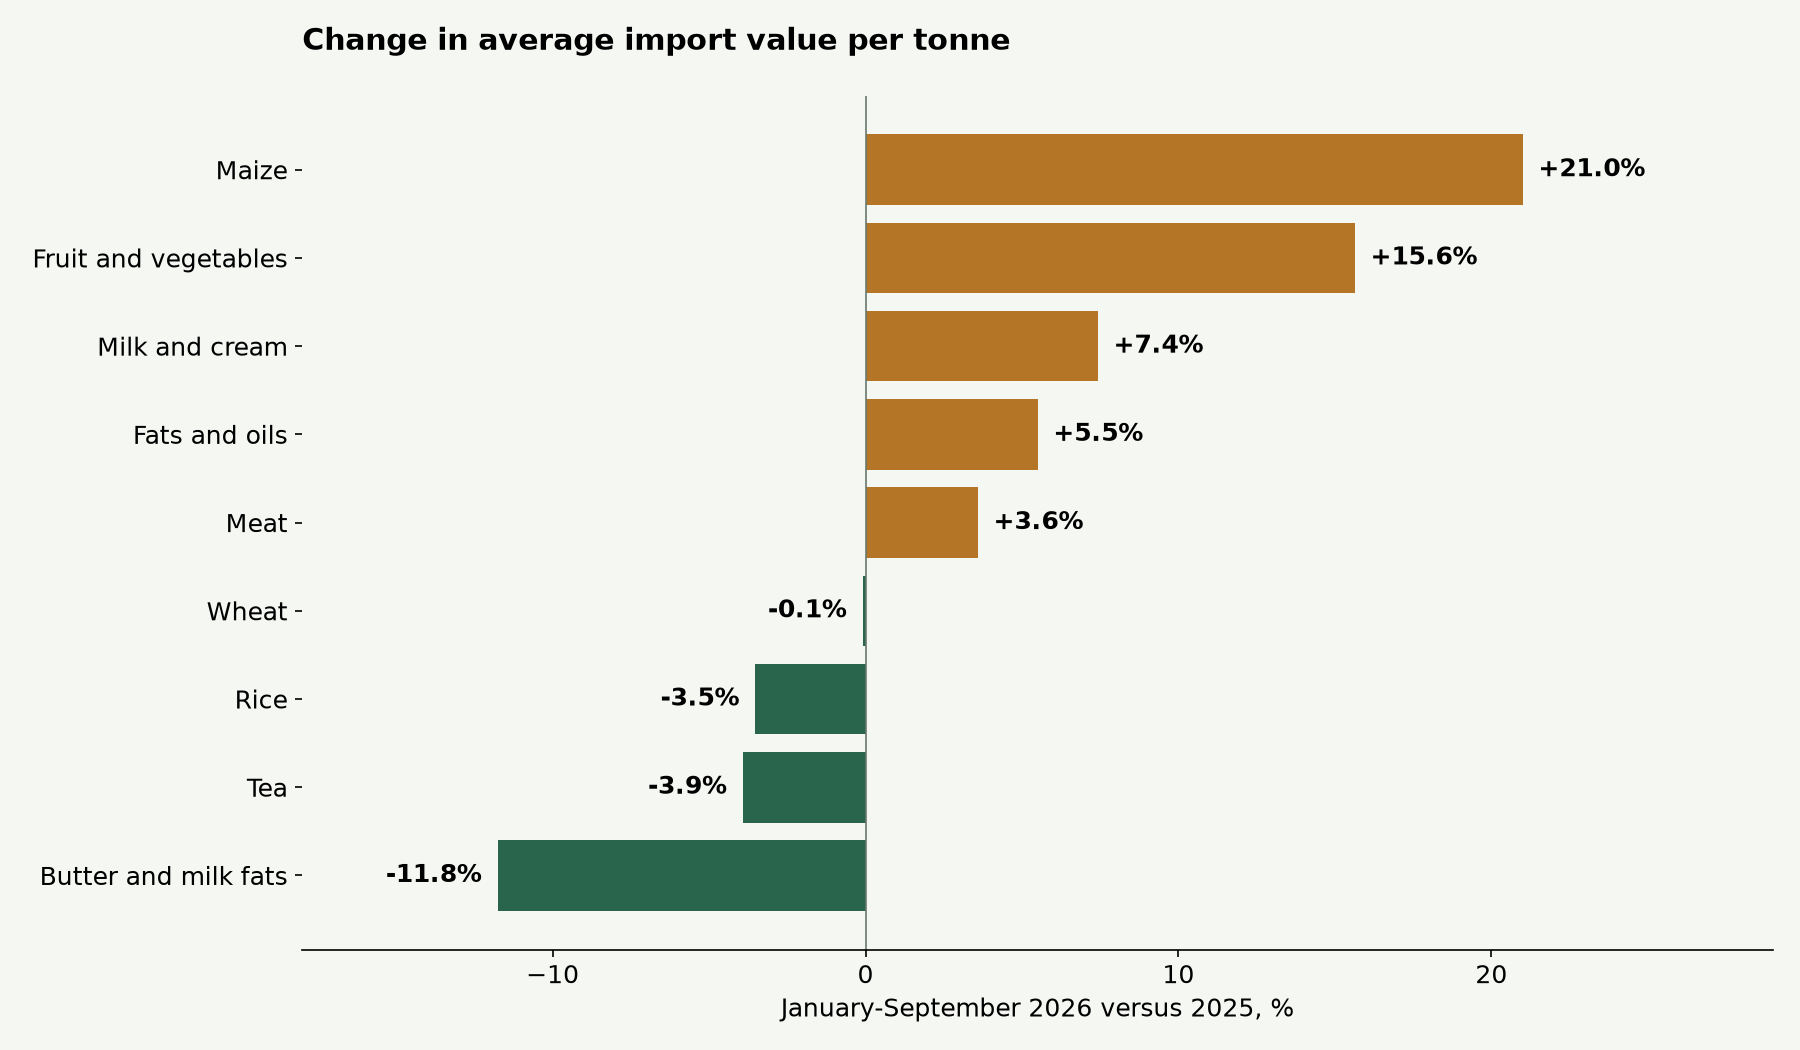
Maize recorded the largest increase in FinFly’s nine-category food-import sample: average customs value per tonne rose 21% in January-September. Fruit and vegetables followed at 15.6%. We divided declared import values by physical volumes, comparing the 2026 customs table with the matching 2025 period. Five categories rose and four declined.
Lower volumes, a higher bill
Maize imports fell 13.7% by weight while spending increased 4.4%. The larger bill therefore reflects higher average value rather than more grain. Fruit and vegetables show a similar divergence: tonnage fell 13.2% but total spending barely changed. The same expenditure purchased fewer tonnes.
A consistent comparison
Both columns cover January-September. Values are dollars per tonne, not retail prices. The sample comprises food categories for which customs publishes both weight and value; it is neither the entire import basket nor a consumer-price index.
| Product / HS code | 2025, $/tonne | 2026, $/tonne | Change |
|---|---|---|---|
| Maize (1005) | 381.28 | 461.36 | +21.0% |
| Fruit and vegetables (07-08) | 806.89 | 933.07 | +15.6% |
| Milk and cream (0401-0402) | 1 762.55 | 1 893.41 | +7.4% |
| Fats and oils (15) | 1 519.89 | 1 603.49 | +5.5% |
| Meat (02) | 2 273.91 | 2 355.54 | +3.6% |
| Wheat (1001) | 214.62 | 214.42 | -0.1% |
| Rice (1006) | 940.80 | 907.63 | -3.5% |
| Tea (0902) | 6 206.45 | 5 962.81 | -3.9% |
| Butter and milk fats (0405) | 6 898.11 | 6 086.90 | -11.8% |
Quantity explains much of the increase
The milk and cream bill rose 53.4%, but average value per tonne increased just 7.4%. Volume, up 42.8%, explains most of the difference. Wheat purchases rose 18.9% by weight and 18.8% by value, leaving unit value close to $214 per tonne. Describing the entire extra expenditure as inflation would confuse two different changes.
Some import categories became cheaper
Butter and milk fats fell 11.8% in average value per tonne; rice and tea declined roughly 3.5-3.9%. External cost pressures are therefore uneven. Procurement decisions need category-level comparisons and contract terms rather than a single headline about the food-import bill.
What retailers can infer
Unit values also reflect quality, grades, origins and the proportion of expensive products. Seasonal changes within the broad fruit-and-vegetable group can shift its average without every product rising in price. The 15.6% increase is not a price rise for each imported fruit. Applicable charges, storage, domestic transport and distribution costs subsequently affect retail economics; this report does not measure them.
Calculation method
We multiplied values reported in thousands of dollars by 1,000 and divided by tonnes. Changes use unrounded inputs. No combined index was calculated: without fixed weights it would mix unit-value movements with changes in the import basket. The results identify procurement categories worth examining, rather than predicting shelf prices.