Microsoft’s results contain two net-income growth rates: 32% under GAAP and 18% excluding the impact of investments in OpenAI. They do not describe two different businesses. They show how strongly growth depends on the comparison base.
In its fiscal 2027 first-quarter release, covering the quarter ended September 30, 2026, Microsoft reported Azure revenue growth of 48%. GAAP net income was $36.629 billion against $27.747 billion a year earlier; adjusted figures were $36.422 billion and $30.833 billion.
Both periods must be adjusted
Comparing only the two current-period profit figures does not explain the different growth rates. The denominator matters: what was the comparable starting value a year earlier?
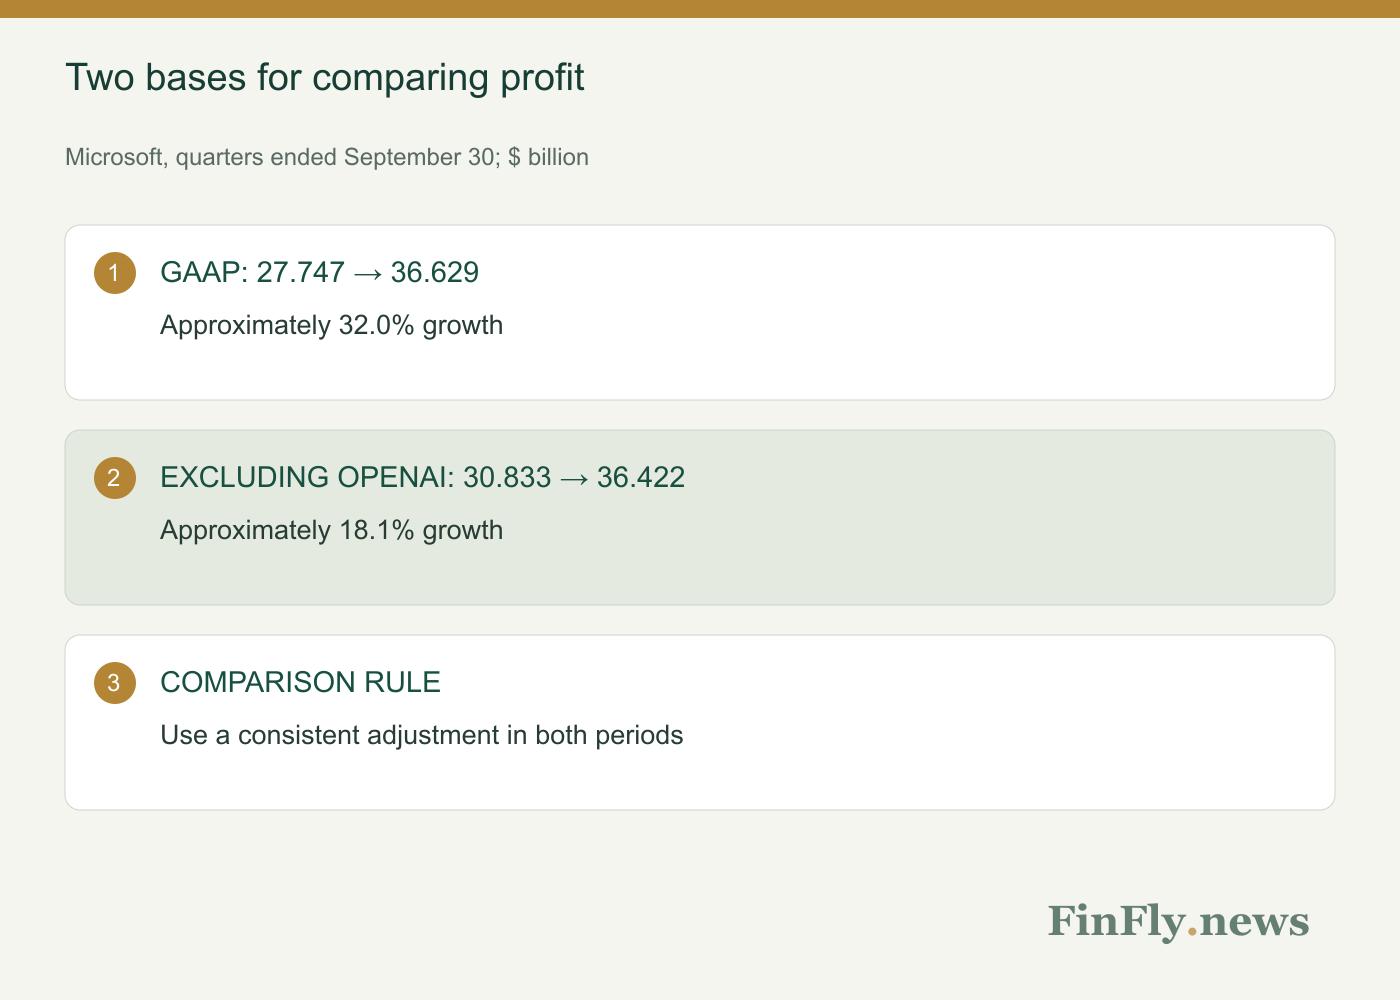
The figures produce approximately 32.0% growth under GAAP and 18.1% on the adjusted basis. The current-period adjustment subtracts $207 million, while the prior-period adjustment adds $3.086 billion. The comparison-base effect is therefore considerably larger than the gap between the two current profit figures might suggest.
Read GAAP and adjusted results together
GAAP captures the financial result under applicable accounting rules. An adjusted measure can isolate a particular factor, but its usefulness depends on what has been excluded. It should not automatically be treated as a superior result.
Both views are useful here: the reported accounting outcome and growth without a specified investment effect. Independent assessment also requires considering whether an excluded item recurs and how it relates to the company’s long-term strategy.
| Basis | 2025, $bn | 2026, $bn | Calculated growth |
|---|---|---|---|
| GAAP | 27.747 | 36.629 | ≈32.0% |
| Excluding OpenAI investment effects | 30.833 | 36.422 | ≈18.1% |
Quarters ended September 30. Microsoft data; growth calculated by FinFly. Not a forecast.
Cloud growth is not every AI product’s return
Azure’s growth measures platform activity, not the economics of an individual customer project. It does not automatically reveal the customer’s savings, an application developer’s margin or the proportion of useful requests.
Analysis of the technology chain should separate compute-provider revenue from user outcomes. Capacity consumption can rise during experimentation too. Durable demand requires a meaningful share of those experiments to become working business processes.
The relevant test for enterprise customers
For a company buying cloud services, the practical calculation starts with the cost of a successfully completed task. That includes compute, storage, integration, quality controls and support. Supplier revenue is not a substitute for this assessment.
Microsoft’s results therefore provide two separate lessons: cloud activity is expanding, and financial comparisons require careful accounting. Strong sales growth matters, but a conclusion about long-term AI efficiency requires evidence about costs and useful output at the customer level.