Third-quarter corporate securities turnover exceeded the total for the entire first half. The main shift came in secondary trading rather than new issuance.
One quarter exceeded the first half
The CBA January-September statistics put corporate securities turnover at AZN 4,148.9 million, against AZN 1,935.3 million in the first half. The difference is AZN 2,213.6 million for the third quarter, 14.4% above the entire first-half total.
This compares a quarter with six months; it is not a year-on-year growth rate. It shows activity concentrated in July-September, but does not establish whether trading exceeded the third quarter of 2025.
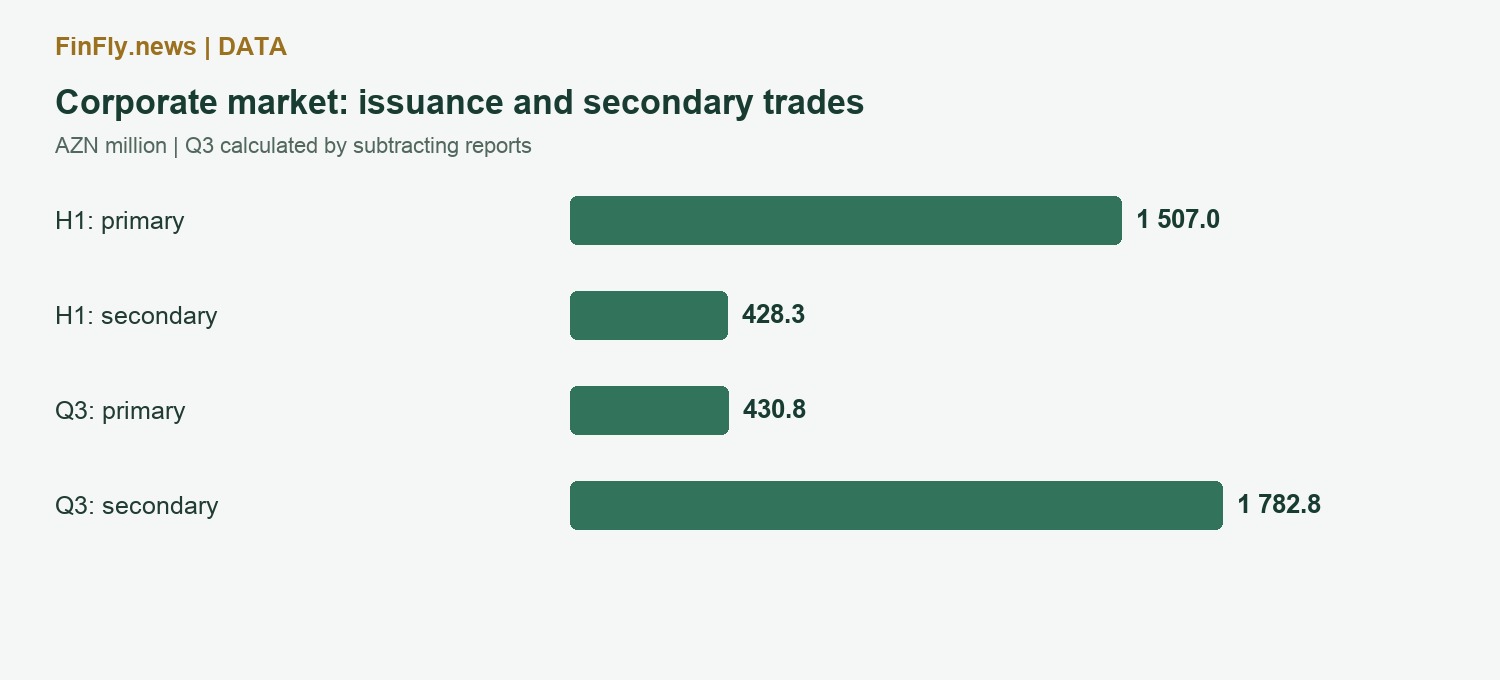
Secondary trading drove the shift
Corporate secondary turnover rose from AZN 428.3 million for the first half to AZN 2,211.1 million for nine months. That leaves AZN 1,782.8 million for the third quarter. Primary placements contributed AZN 430.8 million during the same quarter.
The contrast is stronger in equities. Subtracting the reports gives third-quarter primary equity turnover of only about AZN 2.4 million, compared with approximately AZN 1,426.9 million in secondary trading. The tables identify neither individual issuers nor transactions, so the increase cannot be attributed to a broad influx of new investors.
| Turnover, AZN m | H1 2026 | January-September | Q3* |
|---|---|---|---|
| Corporate securities | 1935.3 | 4148.9 | 2213.6 |
| Equities | 1178.2 | 2607.4 | 1429.2 |
| Corporate bonds | 757.1 | 1541.5 | 784.4 |
| Primary market | 1507 | 1937.8 | 430.8 |
| Secondary market | 428.3 | 2211.1 | 1782.8 |
Bonds showed a more even pattern
Corporate bond turnover was AZN 757.1 million in the first half and AZN 1,541.5 million over nine months. The implied third-quarter figure is AZN 784.4 million. Unlike equities, bonds retained meaningful activity in both issuance and secondary trading.
For issuers, the primary market provides financing; for holders, the secondary market records resales. High turnover does not guarantee liquidity in every security. Without issuer, price and transaction-size breakdowns, market growth cannot be applied to each investor’s experience. All quarterly figures are FinFly calculations obtained by subtracting first-half totals from nine-month data; rounding can cause small discrepancies.